Ternary Plots in Plotly
Last Updated :
01 Oct, 2020
A Plotly is a Python library that is used to design graphs, especially interactive graphs. It can plot various graphs and charts like histogram, barplot, boxplot, spreadplot, and many more. It is mainly used in data analysis as well as financial analysis. plotly is an interactive visualization library.
Ternary Plots in Plotly
A ternary plot is also known as a ternary graph, triangle plot, simplex plot which is a barycentric plot on three variables which sum to a constant. It graphically depicts the ratios of the three variables as positions in an equilateral triangle. It can be created using two-class i.e. express class and graph_objects class.
Using express class
In plotly, express is an easy-to-use,high-level interface that helps to operates a variety of types of data and produce simple style figures. It provides scatter_ternary() method to create ternary plots.
Syntax: scatter_ternary( a=None, b=None, c=None, color=None,labels={},width=None, height=None)
Parameters:
a: Values from this column or array_like are used to position marks along the a axis in ternary coordinates.
b: Values from this column or array_like are used to position marks along the b axis in ternary coordinates.
c: Values from this column or array_like are used to position marks along the c axis in ternary coordinates.
color: Either a name of a column in data_frame, or a pandas Series or array_like object. Values from this column or array_like are used to assign color to marks.
width: The figure width in pixels.
height: The figure height in pixels.
Example:
Python3
import plotly.express as px
df = px.data.iris()
fig = px.scatter_ternary(df, a="sepal_length",
b="sepal_width", c="petal_length",
color="species", size_max=20)
fig.show()
|
Output:

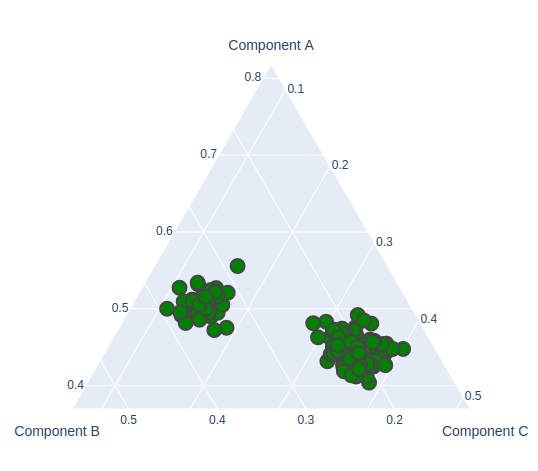
Using Graph_Objects class
Let’s see one example of a ternary scatter plot with plotly graph objects to make it clear. It can be created using the Scatterternary() method.
Example:
Python3
import plotly.express as px
import plotly.graph_objects as go
df = px.data.iris()
fig = go.Figure(go.Scatterternary({
'mode': 'markers',
'a': df['sepal_length'],
'b': df['sepal_width'],
'c': df['petal_length'],
'marker': {
'color': 'green',
'size': 14,
'line': {'width': 2}
}
}))
fig.show()
|
Output:
Like Article
Suggest improvement
Share your thoughts in the comments
Please Login to comment...