Tableau – Design Flow
Last Updated :
22 Oct, 2020
Prerequisites: Tableau Installation Guide, Introduction to Tableau
Tableau is an easy-to-use Business Intelligence tool used in data visualization. Its unique feature is, to allow data real-time collaboration and data blending, etc. Through Tableau, users can connect databases, files, and other big data sources and can create a shareable dashboard through them. Tableau is mainly used by researchers, professionals, and government organizations for data analysis and visualization.
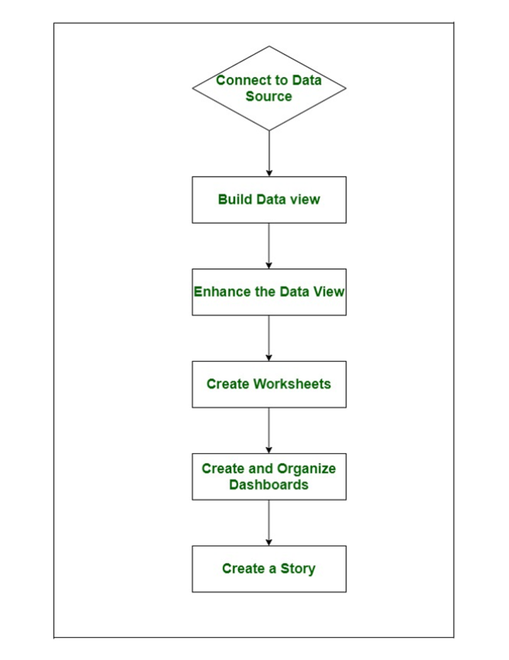
As we know using Tableau we can analyze data sets, plot different graphs, and create dashboards. To get a proper overview of the analyzed data set, dashboards, or story matters a lot. The Dashboard or story is the outcome of the Tableau project. Hence, we must know the best approach to design a good dashboard. Below is the flow diagram that one should follow to create effective and efficient dashboards.
Flow Diagram:

Now below is a brief explanation of each step followed:
1. Connect to Data Source
The first step is to connect the data source to Tableau. Tableau can connect to nearly every data sources like text files, relational sources, SQL sources, or cloud databases, etc. There is an inbuilt connector in Tableau to establish a link with data sources.
2. Build Data Views
The next step is to build views, which are also known as reports. After connecting to the data source, we have columns of data set in the Tableau environment. There is a certain drag and drop feature in Tableau to build views.
3. Enhance the Views
Now views are created, the next step is to enhance them further by using filters, aggregations, labeling of axes, formatting of colors and borders, etc.
4. Create Worksheets
On worksheets, we can build different views of the data set. All analyzes of the data set are performed on worksheets.
5. Create and Organize Dashboards
The dashboard is built by linking more than one worksheet. The worksheets must be organized properly so that the Dashboard will look informative and attractive.
6. Create a Story
When a sheet containing a sequence of worksheets or dashboards come together to convey information, it is known as Story. Stories are created to show how facts are connected, provide context, demonstrate an analyzed report, etc. It is the last step of the Tableau design flow diagram.
Like Article
Suggest improvement
Share your thoughts in the comments
Please Login to comment...