sympy.stats.Dagum() in python
Last Updated :
05 Jun, 2020
With the help of sympy.stats.Dagum() method, we can get the continuous random variable representing the dagum distribution.
Syntax : sympy.stats.Dagum(name, p, a, b)
Where, p, a and b are real number greater than 0.
Return : Return continuous random variable.
Example #1 :
In this example we can see that by using sympy.stats.Dagum() method, we are able to get the continuous random variable which represents the Dagum distribution by using this method.
from sympy.stats import Dagum, density
from sympy import Symbol
p = Symbol("p", integer = True, positive = True)
a = Symbol("a", integer = True, positive = True)
b = Symbol("b", integer = True, positive = True)
z = Symbol("z")
X = Dagum("x", p, a, b)
gfg = density(X)(z)
pprint(gfg)
|
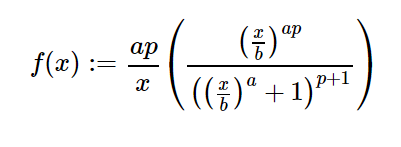
Output :
-p – 1
a*p / a \
/z\ |/z\ |
a*p*|-| *||-| + 1|
\b/ \\b/ /
—————————
z
Example #2 :
from sympy.stats import Dagum, density
from sympy import Symbol
p = 3
a = 2
b = 5
z = 0.4
X = Dagum("x", p, a, b)
gfg = density(X)(z)
pprint(gfg)
|
Output :
3.83308692944853e-6
Like Article
Suggest improvement
Share your thoughts in the comments
Please Login to comment...