Superscript and subscript axis labels in ggplot2 in R
Last Updated :
28 Sep, 2021
In this article, we will see how to use Superscript and Subscript axis labels in ggplot2 in R Programming Language.
First we should load ggplot2 package using library() function. To install and load the ggplot2 package, write following command to R Console.
# To Install ggplot2 package
# (Write this command to R Console)
install.packages("ggplot2")

# Load ggplot2 package
library("ggplot2")
Now, let’s create a DataFrame. Here we will create a simple DataFrame with two variables named X & Y then assign it to the data object. Let’s named it DF. Here we have generated 10 random values for x and y axis using rnorm() function.
# Load Package
library("ggplot2")

# Create a DataFrame
DF <- data.frame(X = rnorm(10),
                 Y = rnorm(10))
To create an R plot, we use ggplot() function and for make it scattered we add geom_point() function to ggplot() function. Here we use some parameters size, fill, color, shape only for better appearance of points on ScatterPlot. For labels at X and Y axis, we use xlab() and ylab() functions respectively.
Syntax:
xlab(“Label for X-Axis”)
ylab(“Label for Y-Axis”)
Example:
R
library("ggplot2")
DF <- data.frame(X = rnorm(10),
Y = rnorm(10))
ggplot(DF,aes(X, Y))+
geom_point(size = 8, fill = "green",
color = "black", shape = 21)+
xlab("X-Axis")+
ylab("Y-Axis")
|
Output:

ScatterPlot with Simple Axis Labels
Adding Superscript Axis Labels
Now we will change the label of X to ” X-Axissuperscript ” and Y to ” Y-Axissuperscript “. For that bquote() function is used to quote the argument passed to it.
Syntax : bquote(expr)
Parameter :
bquote() For SuperScript :
bquote(math superscript(^) Notation)
Example:
R
library("ggplot2")
DF <- data.frame(X = rnorm(10),
Y = rnorm(10))
ggplot(DF,aes(X, Y))+
geom_point(size = 8, fill = "green",
color = "black", shape = 21)+
xlab(bquote(X-Axis^superscript))+
ylab(bquote(Y-Axis^superscript))
|
Output:

ScatterPlot with Superscripted Axis Labels
Adding Subscript Axis Labels
We will change the label of X to ” X-Axissubscript ” and Y to “ Y-Axissubscript “. For that, we will again use the bquote() function but with different Mathematical Notation for subscript.
bquote() For Subscript :
bquote(math subscript([]) Notation)
Example:
R
library("ggplot2")
DF <- data.frame(X = rnorm(10),
Y = rnorm(10))
ggplot(DF,aes(X, Y))+
geom_point(size = 8, fill = "green",
color = "black", shape = 21)+
xlab(bquote(X-Axis[subscript]))+
ylab(bquote(Y-Axis[subscript]))
|
Output:
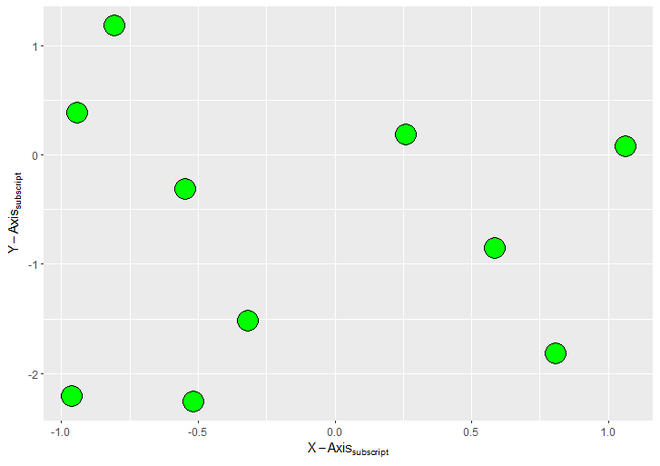
ScatterPlot with Subscripted Axis Labels
Like Article
Suggest improvement
Share your thoughts in the comments
Please Login to comment...