Streamline Plots in Plotly using Python
Last Updated :
23 May, 2022
A Plotly is a Python library that is used to design graphs, especially interactive graphs. It can plot various graphs and charts like histogram, barplot, boxplot, spreadplot, and many more. It is mainly used in data analysis as well as financial analysis. plotly is an interactive visualization library.
Streamline Plots in Plotly
In plotly, streamline plots are based on the representation on a 2-D vector field which is explained as velocity fields, which are consist of closed curves that are tangent to the velocity field. Streamlining is the fastest technique and more efficient for getting the data. Velocity values are interpolated when determining the streamlines. Streamlines are initialized on the boundary of the x-y domain.
Syntax: create_streamline(x, y, u, v, density=1, angle=0.3490658503988659, arrow_scale=0.09)
Parameters:
x: 1 dimensional, evenly spaced list or array
y: 1 dimensional, evenly spaced list or array
u: 2 dimensional array
v: 2 dimensional array
density: controls the density of streamlines in plot. This is multiplied by 30 to scale similarly to other available streamline functions such as matplotlib. Default = 1
angle: angle of arrowhead. Default = pi/9
arrow_scale: value to scale length of arrowhead Default = .09
Example:
Python3
import plotly.figure_factory as ff
import numpy as np
x = np.linspace(-1, 1, 10)
y = np.linspace(-1, 1, 10)
Y, X = np.meshgrid(x, y)
u = 1 - X**2 + Y
v = -1 + X - Y**2
fig = ff.create_streamline(x, y, u, v, arrow_scale=.1)
fig.show()
|
Output:

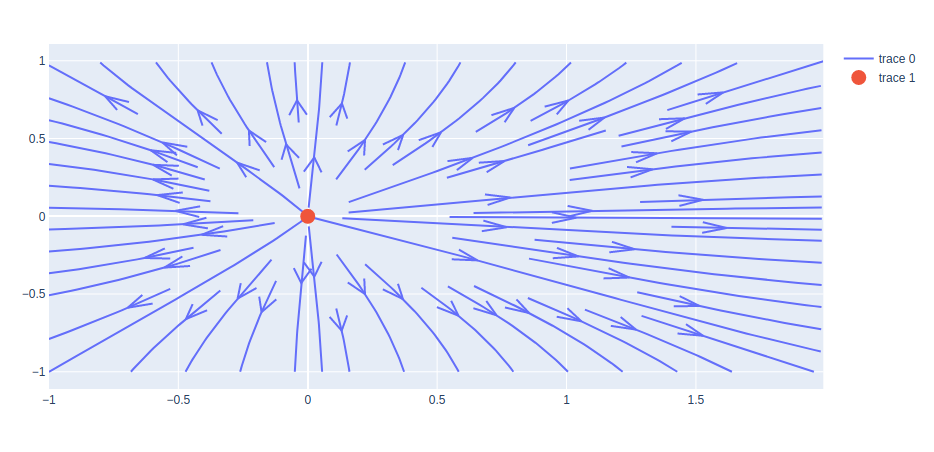
Plotting the Source Point
The source point can be plot using the scatterplot() method of the graph_objects class. In this, the streamline plot and the position of the marker in the scatterplot are tweaked in such a way that it seems that all the stream is originating from a particular source.
Example:
Python3
import plotly.figure_factory as ff
import plotly.graph_objects as go
import numpy as np
x = np.linspace(-1, 2, 50)
y = np.linspace(-1, 1, 50)
Y, X = np.meshgrid(x, y)
u = np.cos(X)*Y
v = np.cos(y)*X
X, Y = 0, 0
fig = ff.create_streamline(x, y, u, v, arrow_scale=.1)
fig.add_trace(go.Scatter(x=[X], y=[Y],
mode='markers',
marker_size=15,
))
fig.show()
|
Output:
Like Article
Suggest improvement
Share your thoughts in the comments
Please Login to comment...