Stratified Sampling in Pandas
Last Updated :
02 Nov, 2021
Stratified Sampling is a sampling technique used to obtain samples that best represent the population. It reduces bias in selecting samples by dividing the population into homogeneous subgroups called strata, and randomly sampling data from each stratum(singular form of strata).
In statistics, stratified sampling is used when the mean values of each stratum will differ. In Machine learning, stratified sampling is commonly used to create test datasets to evaluate models especially when the dataset is significantly large and unbalanced.

Steps involved in stratified sampling
- Separating the Population into Strata: In this step, the population is divided into strata based on similar characteristics and every member of the population must belong to exactly one stratum (singular of strata).
- Determine the sample size: Decide how small or large the sample should be.
- Randomly sampling each stratum: Random samples from each stratum are selected using either Disproportionate sampling where the sample size of each stratum is equal irrespective of the population size of the stratum or Proportionate sampling where the sample size of each stratum is proportional to the population size of the stratum.
Example 1:
In this example, we have a dummy dataset of 10 students and we will sample out 6 students based on their grades, using both disproportionate and proportionate stratified sampling.
Step 1: Create the dummy dataset from a python dictionary using pandas DataFrame
Python3
import pandas as pd
students = {
'Name': ['Lisa', 'Kate', 'Ben', 'Kim', 'Josh',
'Alex', 'Evan', 'Greg', 'Sam', 'Ella'],
'ID': ['001', '002', '003', '004', '005', '006',
'007', '008', '009', '010'],
'Grade': ['A', 'A', 'C', 'B', 'B', 'B', 'C',
'A', 'A', 'A'],
'Category': [2, 3, 1, 3, 2, 3, 3, 1, 2, 1]
}
df = pd.DataFrame(students)
df
|
Output:
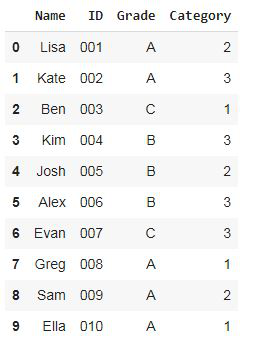
Notice that there are 50% grade A students, 30% grade B students, and 20% grade C students.
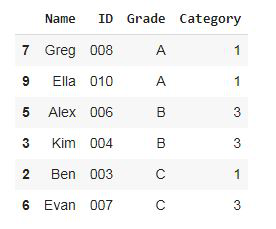
Step 2: Create a sample of 6 students disproportionately (equal number of students from each grade stratum)
Disproportionate Sampling: Using pandas groupby, separate the students into groups based on their grade i.e A, B, C and randomly sample 2 students from each grade group using the sample function
Python3
df.groupby('Grade', group_keys=False).apply(lambda x: x.sample(2))
|
Output:
Step 3: Sample out 60% of students proportionately (create proportional samples from each stratum based on its proportion in the population)
Proportionate Sampling: Using pandas groupby, separate the students into groups based on their grade i.e A, B, C, and random sample from each group based on population proportion. The total sample size is 60%(0.6) of the population
Python3
df.groupby('Grade', group_keys=False).apply(lambda x: x.sample(frac=0.6))
|
Output:
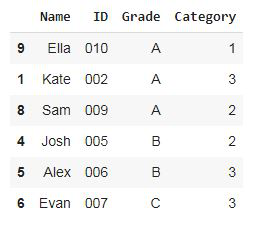
Notice that even in the sample, there are 50% grade A students, 30% grade B students, and 20% grade C students.
Example 2:
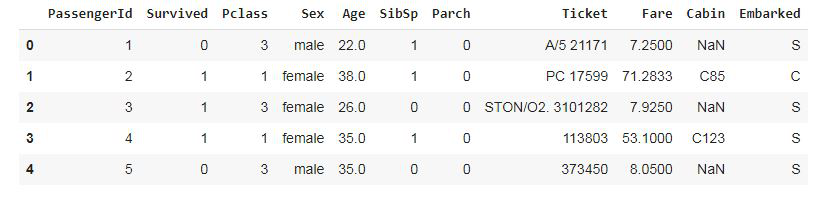
In this example, we will be creating sample data from the train dataset. Titanic was a British passenger that sank in the North Atlantic Ocean after striking an iceberg. The dataset contains information on all passengers who boarded the Titanic, a passenger either died or survived the crash, so we will be using the Survived column as our stratifying column.
Step 1: Read in the dataset from the CSV file
Python3
import pandas as pd
data = pd.read_csv('Titanic.csv')
data.drop('Name', axis=1, inplace=True)
data.head()
|
Output:
Step 2: Check the percentage of dead/survived passengers
Check the proportion/percentage of passengers who died or survived this is given a number of dead or alive passengers / total number of passengers * 100
Python3
(data['Survived'].value_counts()) / len(data) * 100
|
Output:
0    61.616162
1    38.383838
where 0 represents passengers that died (61.6%) and 1 represents passengers that survived (38.4%)
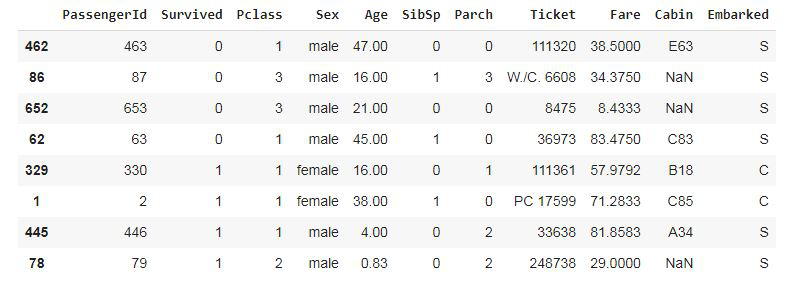
Step 3: Disproportionately sample out 8 passengers (4 who died and 4 who survived)
Python3
data.groupby('Survived', group_keys=False).apply(lambda x: x.sample(4))
|
Output:
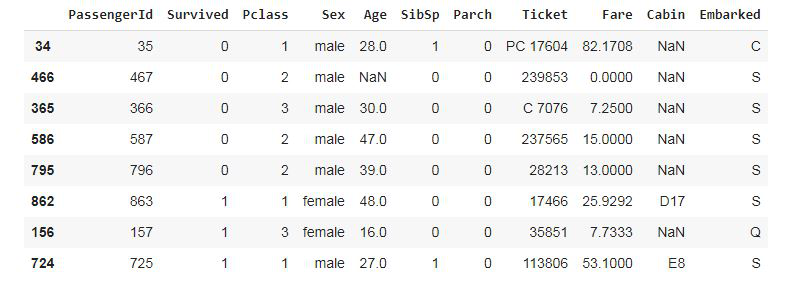
Step 4: Proportionately sample out 1%(0.01) of passengers (0.6% died and 0.4% survived)
Python3
data.groupby('Survived', group_keys=False).
apply(lambda x: x.sample(frac=0.01))
|
Output:
Like Article
Suggest improvement
Share your thoughts in the comments
Please Login to comment...