How to Create a Step Chart in Excel
Last Updated :
25 Sep, 2023
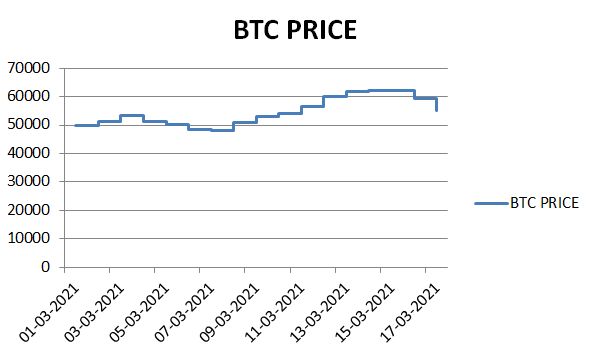
A step chart is used to represent data that changes irregularly between time intervals. Now, Excel doesn’t have a feature to create a Step Chart like the one shown below but we can create one by making some changes in our data.
What is a Step Chart in Excel
A Step chart is the same as a Line Chart. The step Chart does not use the shortest path to connect two data points. It instead uses vertical and horizontal lines to connect the data points to form a step-like progression. The vertical lines in the graph show the changes in the data and their magnitude.
Line Chart Vs. Step Chart
Both the line and step chart may appear similar at first sight, but there are differences between both of them.
- A line Chart helps us to see the trend by connecting the data points. The primary motive of such a chart is the trend and not the Exact time of change.
- Whereas, a step chart helps highlight the exact time of change in the data, along with the trend. You can easily spot the time period where there was no change and compare the magnitude of change in each instance.
.png)
How to Create a Step Chart in Excel
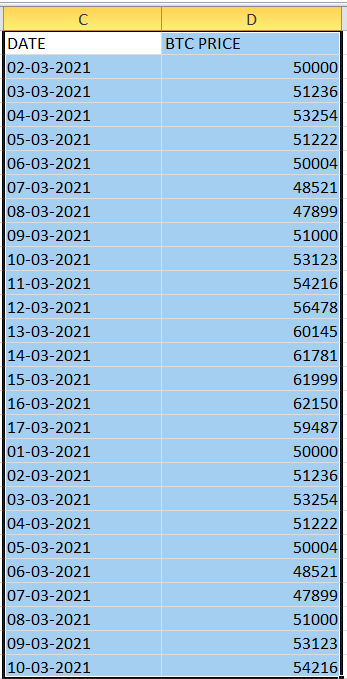
Step 1: Create your Data Table
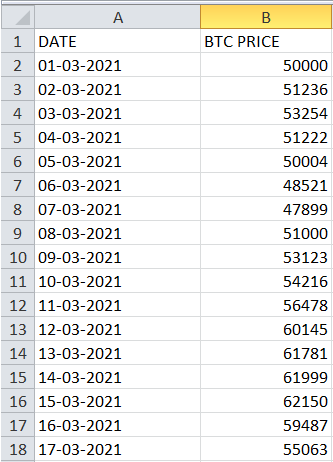
In this article, we’ll make a Step Chart based on the Bitcoin Prices over a few weeks. So, let us create our data table first.
Note: In this article we are using MS Excel 2010, but above steps are valid for all the latest versions.
Step 2: Re-arrangement of data
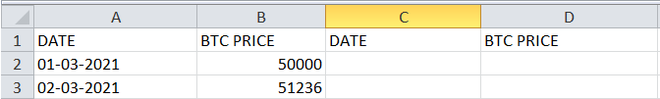
Now, once your data is ready, make two more empty columns with the same titles adjacent to the ones you just made.
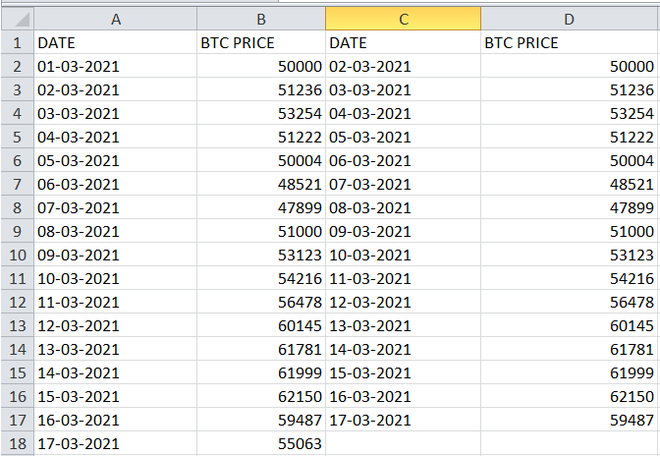
Now, select all the cells from A2 till the end of your column (in this case A18) and press Ctrl + C, to copy it. Then, paste it in the new DATE column. Similarly, copy from the FIRST element of the BTC PRICE column to the second last element and paste it into the new BTC PRICE column. The final result will look like this.
Now, copy all the elements from both the old columns and paste them right under the new columns as shown below.
Part 1
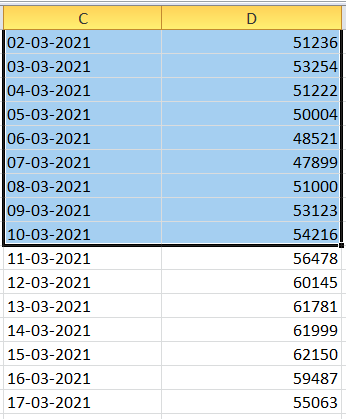
Part 2
Step 3: Conversion to Step Chart
Select both the new columns entirely and go to Insert. Locate the Line Chart under the Charts section and click on it.
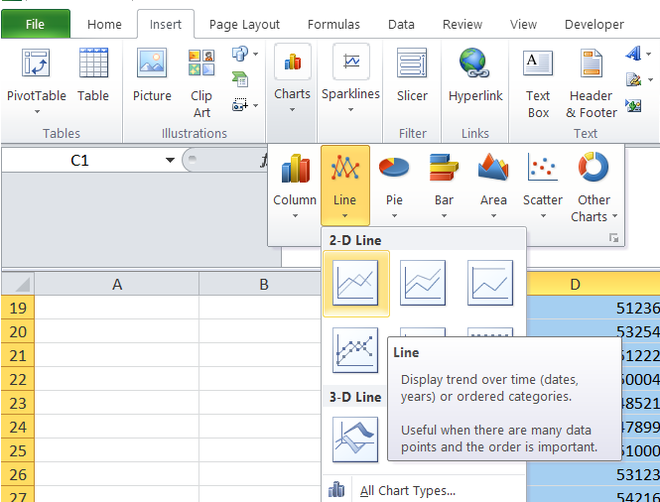
Now, wait for the chart to show up, and you’ll be all set!
Advantages of using a Step Chart in Excel
A step chart in Excel is useful for data that changes at irregular intervals of time. For example:
- Interest rates vs. time
- Tax Rates vs. Income
- Distance covered vs. time taken
How to Create a Step Chart Without Dates
Making a step chart without dates is simple. A step chart, also called a step plot or step line chart, helps display data that changes in distinct steps, not continuously. Here’s how to create one without dates
In this situation, Excel separates the months into two sections: first, Jan to June and Second Jan to June
So, it’s clear that making a step chart with text labels instead of dates can be tricky. But don’t worry; there’s a solution. When you’re dealing with months or years, simply convert them into a date format.
For example, instead of using “Jan,” “Feb,” “Mar,” and so on, use “01-Jan-2023,” “02-Feb-2023” “03-Mar-2023,” and then extract the month information from these dates using custom formatting, like this:

Now Convert the Chart into Step Chart

FAQs
How to quickly create a Step chart in Excel?
Follow the below steps to create a Step Chart in Excel:
Step 1: Organize your data with X and Y axis
Step 2: Insert a scatter chart using the data
Step 3: Change the scatter Chart to a line Chart with markers.
Step 4: Fine- tune the chart by adding axis labels, a title, legends, data labels, gridlines, and other formatting options.
How to edit a step chart in Excel after creating it?
Follow the below step to edit a step chart in Excel:
Step 1: Right-click on Various chart elements, such as data points, axis labels, or the chart area, and choose the “Format” or “Edit” option.
This will allow you to customize colors, line styles, data labels, and other aspects of the Chart.
How to create a Step Chart with date-based data in Excel?
To create a Step Chart with a date based you simply, you just need to ensure that your data is correctly formatted in the X-axis, and Excel will handle the rest of the Chart creation process.
Like Article
Suggest improvement
Share your thoughts in the comments
Please Login to comment...