Standard Deviation is the measure of the dispersion of statistics. Standard deviation formula is used to find the deviation of the data value from the mean value i.e. it is used to find the dispersion of all the values in a data set to the mean value. There are different standard deviation formulas to calculate the standard deviation of a random variable.
In this article, we will learn about what is standard deviation, Standard Deviation Formula Excel, standard deviation formulas, how to calculate standard deviation, and Standard Deviation Formula Example in detail.
What is Standard Deviation?
Standard Deviation is defined as the degree of dispersion of the data point to the mean value of the data point. It tells us how the value of the data points varies to the mean value of the data point and it tells us about the variation of the data point in the sample of the data.
Standard Deviation of a given sample of data set is also defined as the square root of the variance of the data set. Mean Deviation of the n values (say x1, x2, x3, …, xn) is calculated by taking the sum of the squares of the difference of each value from the mean, i.e.
Mean Deviation = 1/n∑in (xi – x̄)2

Mean Deviation is used to tell us about the scatter of the data. The lower degree of deviation tells us that the observations xi are close to the mean value and the depression is low, whereas the higher degree of deviation tells us that the observations xi are far from the mean value and the dispersion is high.
Standard Deviation Definition
Standard deviation is a measure used in statistics to understand how the data points in a set are spread out from the mean value. It indicates the extent of the data’s variation and shows how far individual data points deviate from the average.
Check: How to find the Standard deviation in Statistics?
Standard deviation is used to measure the spread of the statistical data. It tells us about how the statistical data is spread out. Formula to Calculate Standard Deviation is used to find the deviation of all the data sets from its mean position. You may have questions that standard deviation how to calculate or how to calculate a standard deviation. There are two standard deviation formulas that are used to find the Standard Deviation of any given data set. They are,
- Population Standard Deviation Formula
- Standard Deviation Formula Sample
Formula for standard deviation of sample data is,
[Tex] \bold{s = \sqrt{\frac{\sum_{i=1}^n (x_i – x̄)^2}{n-1}}}[/Tex]
where,
- s is Population Standard Deviation
- xi is ith observation
- x̄ is Sample Mean
- N is Number of Observations
Standard Deviation Formula of population data is,
[Tex] \bold{\sigma = \sqrt{\frac{\sum_{i=1}^N (x_i – \mu)^2}{N}}}
[/Tex]
where,
- σ is Population Standard Deviation
- xi is ith Observation
- μ is Population Mean
- N is Number of Observations
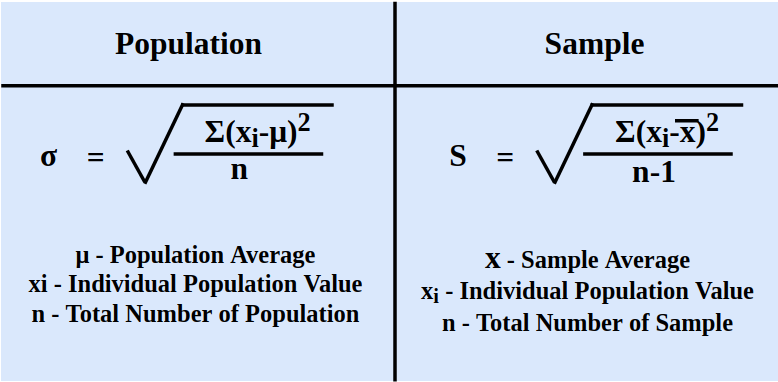
It is evident to note that both formulas look the same and have only slide changes in their denominator. Denominator in case of the sample is n-1 but in case of the population is N. Initially the denominator in the sample standard deviation formula has “n” in its denominator but the result from this formula was not appropriate. So a correction was made and the n is replaced with n-1 this correction is called Bessel’s correction which in turn produced the most appropriate results.
Read More: Difference Between Variance and Standard Deviation
Formula for Calculating Standard Deviation
Formula used for calculating Standard Deviation is discussed in the image below,
How to Calculate Standard Deviation?
Generally, when we talk about standard deviation we talk about population standard deviation. The steps to calculate standard deviation of a given set of values are as follows,
Step 1: Calculate mean of observation using the formula
(Mean = Sum of Observations/Number of Observations)
Step 2: Calculate squared differences of data values from the mean.
(Data Value – Mean)2
Step 3: Calculate average of squared differences.
(Variance = Sum of Squared Differences / Number of Observations)
Step 4: Calculate square root of variance this gives the Standard Deviation.
(Standard Deviation = √Variance)
What is Variance
Variance basically tells us how spread out a set of data is. If all the data points are the same, the variance is zero. Any non-zero variance is considered positive. Low variance means the data points are close to the average (or mean) and to each other. High variance means the data points are spread out from the average and from each other. In simple terms, variance is the average of how far each data point is from the mean, squared.
Difference between Variance and Deviation
| Aspect | Variance | Deviation (Standard Deviation) |
|---|
| Definition | Measure of spread in a dataset. | Measure of average distance from the mean. |
|---|
| Calculation | Average of squared differences from the mean. | Square root of the variance. |
|---|
| Symbol | σ^2 (sigma squared) | σ (sigma) |
|---|
| Interpretation | Indicates the average squared deviation of data points from the mean. | Indicates the average distance of data points from the mean. |
|---|
Check:
The formula to calculate the variance of a dataset is as follows:
Variance (σ^2) = Σ [(x – μ)^2] / N
Where:
- Σ denotes summation (adding up)
- x represents each individual data point
- μ (mu) is the mean (average) of the dataset
- N is the total number of data points
How to calculate variance
The steps to calculate the variance of a dataset:
Step1: Calculate the Mean (Average):
Add up all the values in the dataset and divide by the total number of values. This gives you the mean (μ).
Mean (μ) = (Sum of all values) / (Total number of values)
Step2: Find the Squared Differences from the Mean:
For each value in the dataset, subtract the mean calculated in the first step from that value, and then square the result. This gives you the squared difference for each value.
Squared Difference for each value = (Value – Mean)^2
Step3: Calculate the Average of the Squared Differences:
Add up all the squared differences calculated in the previous step, and then divide by the total number of values in the dataset. This gives you the variance (σ^2).
Variance (σ^2) = (Sum of all squared differences) / (Total number of values)
Check: Variance and Standard Deviation
Standard Deviation of Ungrouped Data
For ungrouped data, the standard deviation can be calculated using three methods that are,
- Actual Mean Method
- Assumed Mean Method
- Step Deviation Methood
Standard Deviation by Actual Mean Method
Standard Deviation by actual mean method uses the basic mean formula to calculate the mean of the given data and using this mean value we find out the standard deviation of the given data values. We calculate the mean in this method with the formula,
μ = (Sum of Observations)/(Number of Observations)
and then the standard deviation is calculated using the standard deviation formula.
σ = √(∑in (xi – x̄)2/n)
Example: Find Standard Deviation of data set. X = {2, 3, 4, 5, 6}
Solution:
Given,
- n = 5
- xi = {2, 3, 4, 5, 6}
We know,
Mean(μ) = (Sum of Observations)/(Number of Observations)
⇒ μ = (2 + 3 + 4 + 5 + 6)/ 5
⇒ μ = 4
σ2 = ∑in (xi – x̄)2/n
⇒ σ2 = 1/n[(2 – 4)2 + (3 – 4)2 + (4 – 4)2 + (5 – 4)2 + (6 – 4)2]
⇒ σ2 = 10/5 = 2
Thus, σ = √(2) = 1.414
Standard Deviation by Assumed Mean Method
For very large values of x finding the mean of the grouped data is a tedious task so we assumed an arbitrary value (A) as the mean value and then calculated the standard deviation using the normal method. Suppose for the group of n data values ( x1, x2, x3, …, xn), the assumed mean is A then the deviation is,
di = xi – A
Now, assumed mean formula is,
σ = √(∑in (di)2/n)
Standard Deviation by Step Deviation Method
We can also calculate the standard deviation of the grouped data using the step deviation method. As in the above method in this method also, we also choose some arbitrary data value as the assumed mean (say A). Then we calculate the deviations of all data values (x1, x2, x3, …, xn), di = xi – A
In next step, we calculate the Step Deviations (d’) using
d’ = d/i
where ‘i‘ is a Common Factor of all ‘d’ Values
Then, standard deviation formula is,
σ = √[(∑(d’)2 /n) – (∑d’n)2] × i
where ‘n‘ is Total Number of Data Values
Standard Deviation of Discrete Grouped Data
In grouped data first, we made a frequency table and then any further calculation was made. For discrete grouped data, the standard deviation can also be calculated using three methods that are,
- Actual Mean Method
- Assumed Mean Method
- Step Deviation Method
Standard Deviation Formula Based on Discrete Frequency Distribution
For a given data set if it has n values (x1, x2, x3, …, xn) and the frequency corresponding to them is (f1, f2, f3, …, fn) then its standard deviation is calculated using the formula,
σ = √(∑in fi(xi – x̄)2/n)
where,
- n is Total Frequency (n = f1 + f2 + f3 +…+ fn )
- x̄ is Mean of Data
Example: Calculate the standard deviation for the given data
Solution:
Mean (x̄) = ∑(fi xi)/∑(fi)
⇒ Mean (μ) = (10×1 + 4×3 + 6×5 + 8×1)/(1+3+5+1)
⇒ Mean (μ) = 60/10 = 6
n = ∑(fi) = 1+3+5+1 = 10
| xi | fi | fixi | (xi – x̄) | (xi – x̄)2 | fi(xi – x̄)2 |
|---|
| 10 | 1 | 10 | 4 | 16 | 16 |
| 4 | 3 | 12 | -2 | 4 | 12 |
| 6 | 5 | 30 | 0 | 0 | 0 |
| 8 | 1 | 8 | 2 | 4 | 8 |
Now,
σ = √(∑in fi(xi – x̄)2/n)
⇒ σ = √[(16 + 12 + 0 +8)/10]
⇒ σ = √(3.6) = 1.897
Standard Derivation(σ) = 1.897
Standard Deviation of Discrete Data by Assumed Mean Method
In grouped data, if the values in the given data set are very large, then we assumed a random value (say A) as the mean of the data. Then the deviation of each value from the assumed mean is calculated as,
di = xi – A
Now formula for standard deviation by assumed mean method is,
σ = √[(∑(fidi)2 /n) – (∑fidi/n)2]
where,
- ‘f‘ is Frequency of Data Value x
- ‘n‘ is Total Frequency [n = ∑(fi)]
Standard Deviation of Discrete Data by Step Deviation Method
We can also use the step deviation method to calculate the standard deviation of the discrete grouped data. As in the above method in this method also, we also choose some arbitrary data value as the assumed mean (say A). Then we calculate the deviations of all data values (x1, x2, x3, …, xn), di = xi – A
In next step, we calculate the Step Deviations (d’) using
d’ = d/i
where ‘i‘ is Common Factor of all ‘d‘ values
Then, standard deviation formula is,
σ = √[(∑(fd’)2 /n) – (�’/n)2] × i
where ‘n‘ is Total Number of Data Values
Standard Deviation of Continuous Grouped Data
For the continuous grouped data we can easily calculate the standard deviation using the Discrete data formulas by replacing each class with its midpoint (as xi) and then normally calculating the formulas.
Midpoint of each class is calculated using formula,
xi (Midpoint) = (Upper Bound + Lower Bound)/2
For example, Calculate standard deviation of continuous grouped data as given in table,
| Class | 0-10 | 10-20 | 20-30 | 30-40 |
|---|
Frequency(fi)
| 2 | 4 | 2 | 2 |
|---|
Actual Mean Method
- Assumed Mean Method
- Step Deviation Method
We can use any of above methods to find the standard deviation. Here we find standard deviation using the actual mean method.
Solution to above question is,
| Class | 5-15 | 15-25 | 25-35 | 35-45 |
|---|
| xi | 10 | 20 | 30 | 40 |
|---|
Frequency(fi)
| 2 | 4 | 2 | 2 |
|---|
Mean (x̄) = ∑(fi xi)/∑(fi)
⇒ Mean (μ) = (10×2 + 20×4 + 30×2 + 40×2)/(2+4+2+2)
⇒ Mean (μ) = 240/10 = 24
n = ∑(fi) = 2+4+2+2 = 10
| xi | fi | fixi
| (xi – x̄)
| (xi – x̄)2
| fi(xi – x̄)2
|
|---|
| 10 | 2 | 20 | 14 | 196 | 392 |
| 20 | 4 | 80 | -4 | 16 | 64 |
| 30 | 2 | 60 | 6 | 36 | 72 |
| 40 | 2 | 80 | 16 | 256 | 512 |
Now,
σ = √(∑in fi(xi – x̄)2/n)
⇒ σ = √[(392 + 64 + 72 +512)/10]
⇒ σ = √(104) = 10.198
Standard Derivation(σ) = 10.198
Similarly, other methods can also be used to find standard deviation of continuous grouped data.
Check: Standard Deviation in Individual Series
Standard Deviation of Probability Distribution
In probability of all the possible outcomes is generally equal and we take many trials to find the experimental probability of the given experiment.
- For a normal distribution, the mean expected mean is zero and the Standard Deviation is 1.
- For a binomial distribution, the standard deviation is given by the formula,
σ = √(npq)
where,
- n is Number of Trials
- p is Probability of Success of Trial
- q is Probability of Failure of Trial (q = 1 – p)
- For a Poisson distribution, standard deviation is given by
σ = √λt
where,
- λ is Average Number of Successes
- t is Given Time Interval
Standard Deviation of Random Variables
Random variables are the numerical values that denote the possible outcome of the random experiment in the sample space. Calculating the standard deviation of the random variable tells us about the probability distribution of the random variable and the degree of the difference from the expected value.
We use X, Y, and Z as function to represent the random variables. The probability of the random variable is denoted as P(X) and the expected value is denoted by the μ symbol.
Then standard deviation of probability distribution is given using formula,
σ = √(∑ (xi – μ)2 × P(X)/n)
Read More,
Standard Deviation Formula Example
Example 1: Find the Standard Deviation of the following data,
Solution:
First make the table as follows, so we can calculate the further values easily.
Xi
| fi
| Xi×fi
| Xi-μ
| (Xi-μ)2
| f×(Xi-μ)2
|
|---|
5
| 2
| 10
| -6.375
| 40.64
| 81.28
|
12
| 3
| 36
| 0.625
| 0.39
| 1.17
|
15
| 3
| 45
| 3.625
| 13.14
| 39.42
|
Total
| 8
| 91
|
|
| 121.87
|
Mean (μ) = ∑(fi xi)/∑(fi)
⇒ Mean (μ) = 91/8 = 11.375
σ = √(∑in fi(xi – μ)2/n)
⇒ σ = √[(121.87)/(8)]
⇒ σ = √(15.234)
⇒ σ = 3.90
Standard Derivation(σ) = 3.90
Example 2: Find Standard Deviation of following data table.
| Class | Frequency |
|---|
0-10
| 3
|
10-20
| 6
|
20-30
| 4
|
30-40
| 2
|
40-50
| 1
|
Solution:
Class
| Xi
| fi
| f×Xi
| Xi – μ
| (Xi – μ)2
| f×(Xi – μ)2
|
|---|
0-10
| 5
| 3
| 15
| -15
| 225
| 675
|
10-20
| 15
| 6
| 90
| -5
| 25
| 150
|
20-30
| 25
| 4
| 100
| 5
| 25
| 100
|
30-40
| 35
| 2
| 70
| 15
| 225
| 450
|
40-50
| 45
| 1
| 45
| 25
| 625
| 625
|
Total
|
| 16
| 320
|
|
| 2000
|
Mean (μ) = ∑(fi xi)/∑(fi)
⇒ Mean (μ) = 320/16 = 20
σ = √(∑in fi(xi – μ)2/n)
⇒ σ = √[(2000)/(16)]
⇒ σ = √(125)
⇒ σ = 11.18
Standard Derivation(σ) = 11.18
Check: Methods of Calculating Standard Deviation in Discrete Series
For a comprehensive collection of maths formulas across different grade levels and concepts, keep following GeeksforGeeks.
Also, Check
- Easy Calculation: Use Excel’s built-in functions
STDEV.P for the entire population or STDEV.S for a sample. - Step-by-Step Guide: Enter your data set in a single column, then type
=STDEV.S(A1:A10) (replace A1:A10 with your data range) in a new cell to get the standard deviation for a sample. - Visual Aids: Utilize Excel’s chart tools to visually represent data variability alongside standard deviation.
Check: Methods of calculation of Standard Deviation in frequency distribution series
- Core Concept: Standard deviation measures the amount of variation or dispersion of a set of values.
- Key Insight: A low standard deviation indicates that the values tend to be close to the mean, while a high standard deviation indicates that the values are spread out over a wider range.
- Statistical Significance: Used to determine if differences between groups are due to chance, especially in hypothesis testing and experimental data analysis.
Conclusion of Standard Deviation
The standard deviation provides valuable information about the variability or consistency within a dataset. It is widely used in various fields, including statistics, finance, and science, to understand the distribution of data and make informed decisions based on the level of variability present.
Standard Deviation – FAQs
What is Standard Deviation in Statistics?
Standard deviation defines the volatility in the values of the data with respect mean value of the given data set. It is defined as the square root of the square of the mean of deviation.
How to Calculate Standard Deviation?
Standard Deviation is calculated using formula,
σ = [Tex] \sqrt{\frac{\sum_{i=1}^N (x_i – \mu)^2}{N}}
[/Tex]
Why Standard Deviation is used?
Standard deviation is used for a variety of purposes some of its important uses are,
- It is used for finding the volatility in the values of the data with respect to the mean value.
- It is used to find the range of deviation of the data.
- It predicts the maximum volatility in the given value of the data set.
What Is Difference Between Standard Deviation and Variance?
Variance is calculated by taking the average of the squared deviation from the mean, whereas standard deviation is the square root of the variance. The other difference between them is in their unit. Standard deviation is expressed in the same units as the original values while Variance is expressed in unit2.
How is Standard Deviation for Ungrouped Data is Found?
Standard Deviation for ungrouped is found using three methods,
- Actual Mean Method
- Assumed Mean Method
- Step Deviation Method
Can Standard Deviation be Negative?
No, standard deviation can never be negative as we can see in the formula all the terms which can be negative are squared.
What is Standard Deviation Explain with Examples?
Standard Deviation is the measure of the variation or dispersion of the given values of the data set.
Example: To find mean of 1, 2, 3, and 4
Mean of Data = 13/4 = 3.25
Standard Deviation = √[(3.25-1)2 + (3-3.25)2 + (4-3.25)2 + (5-3.25)2]/4 = √2.06 = 1.43
What is Formula for Standard Deviation?
Standard Deviation Formula is,
Standard Deviation (σ) = √[ Σ(x – μ) 2/ N]
When Standard Deviation is 1?
Standard Deviation with 1 and mean 0 is called Standard Normal Distribution.
What is Standard Deviation of First 10 Natural Numbers?
Standard Deviation of first 10 natural number is 2.87
What is Standard Deviation of 40, 42, and 48?
Standard deviation of 40, 42 and 48 is 3.399
What Standard Deviation Tell You?
Standard Deviation is a measure of spread for normal distribution. Standard Deviation tells us the spread of the data set around the mean value of the data set.
Like Article
Suggest improvement
Share your thoughts in the comments
Please Login to comment...