Split Pandas Dataframe by column value
Last Updated :
20 Apr, 2022
Sometimes in order to analyze the Dataframe more accurately, we need to split it into 2 or more parts. The Pandas provide the feature to split Dataframe according to column index, row index, and column values, etc.
Let’ see how to Split Pandas Dataframe by column value in Python?
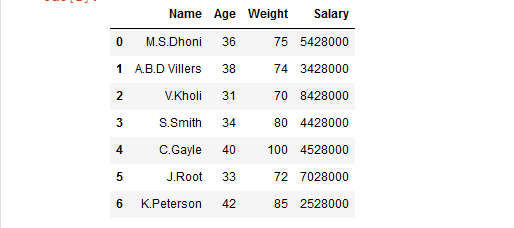
Now, let’s create a Dataframe:
villiers
Python3
import pandas as pd
player_list = [['M.S.Dhoni', 36, 75, 5428000],
['A.B.D Villiers', 38, 74, 3428000],
['V.Kholi', 31, 70, 8428000],
['S.Smith', 34, 80, 4428000],
['C.Gayle', 40, 100, 4528000],
['J.Root', 33, 72, 7028000],
['K.Peterson', 42, 85, 2528000]]
df = pd.DataFrame(player_list,
columns = ['Name', 'Age',
'Weight', 'Salary'])
df
|
Output:
Method 1: Using boolean masking approach.
This method is used to print only that part of dataframe in which we pass a boolean value True.
Example 1:
Python3
import pandas as pd
player_list = [['M.S.Dhoni', 36, 75, 5428000],
['A.B.D Villiers', 38, 74, 3428000],
['V.Kholi', 31, 70, 8428000],
['S.Smith', 34, 80, 4428000],
['C.Gayle', 40, 100, 4528000],
['J.Root', 33, 72, 7028000],
['K.Peterson', 42, 85, 2528000]]
df = pd.DataFrame(player_list,
columns = ['Name', 'Age',
'Weight', 'Salary'])
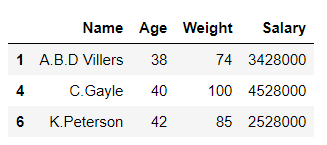
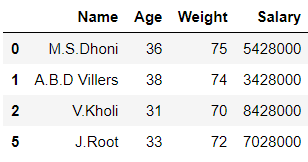
df1 = df[df['Age'] >= 37]
df1
|
Output:
Python3
df2 = df[df['Age'] < 37]
df2
|
Output:
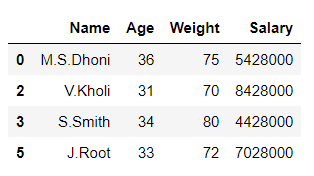
In the above example, the data frame ‘df’ is split into 2 parts ‘df1’ and ‘df2’ on the basis of values of column ‘Age‘.
Example 2:
Python3
import pandas as pd
player_list = [['M.S.Dhoni', 36, 75, 5428000],
['A.B.D Villiers', 38, 74, 3428000],
['V.Kholi', 31, 70, 8428000],
['S.Smith', 34, 80, 4428000],
['C.Gayle', 40, 100, 4528000],
['J.Root', 33, 72, 7028000],
['K.Peterson', 42, 85, 2528000]]
df = pd.DataFrame(player_list,
columns = ['Name', 'Age',
'Weight', 'Salary'])
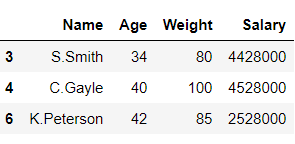
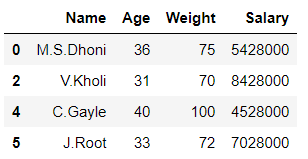
mask = df['Weight'] >= 80
df1 = df[mask]
df2 = df[~mask]
df1
|
Output:
Output:
In the above example, the data frame ‘df’ is split into 2 parts ‘df1’ and ‘df2’ on the basis of values of column ‘Weight‘.
Method 2: Using Dataframe.groupby().
This method is used to split the data into groups based on some criteria.
Example:
Python3
import pandas as pd
player_list = [['M.S.Dhoni', 36, 75, 5428000],
['A.B.D Villiers', 38, 74, 3428000],
['V.Kholi', 31, 70, 8428000],
['S.Smith', 34, 80, 4428000],
['C.Gayle', 40, 100, 4528000],
['J.Root', 33, 72, 7028000],
['K.Peterson', 42, 85, 2528000]]
df = pd.DataFrame(player_list,
columns = ['Name', 'Age',
'Weight', 'Salary'])
df1, df2 = [x for _, x in df.groupby(df['Salary'] < 4528000)]
df1
|
Output:
Output:
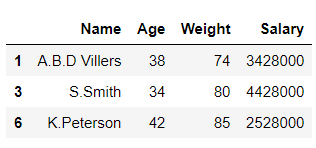
In the above example, the data frame ‘df’ is split into 2 parts ‘df1’ and ‘df2’ on the basis of values of column ‘Salary‘.
Share your thoughts in the comments
Please Login to comment...