Spectral Co-Clustering Algorithm in Scikit Learn
Last Updated :
09 Jan, 2023
Spectral co-clustering is a type of clustering algorithm that is used to find clusters in both rows and columns of a data matrix simultaneously. This is different from traditional clustering algorithms, which only cluster the rows or columns of a data matrix.
Spectral co-clustering is a powerful tool for data analysis, as it can help to uncover hidden patterns and relationships in the data. For example, it can be used to identify groups of similar items in a recommendation system or to find clusters of genes that have similar expression patterns in a gene expression dataset.
In this article, we will discuss the spectral co-clustering algorithm and how it can be implemented in Python using the Scikit-Learn library.
Spectral Co-Clustering Algorithm
Spectral co-clustering is a clustering algorithm that uses spectral graph theory to find clusters in both rows and columns of a data matrix simultaneously. This is done by constructing a bi-partite graph from the data matrix, where the rows and columns of the matrix are represented as nodes in the graph, and the entries in the matrix are represented as edges between the nodes.
The spectral co-clustering algorithm then uses the eigenvectors of the graph Laplacian to find the clusters in the data matrix. This is done by treating the rows and columns of the data matrix as two separate sets of nodes and using the eigenvectors to partition each set into clusters.
One advantage of the spectral co-clustering algorithm is that it can handle data with missing entries. This is because the algorithm only uses the non-zero entries in the data matrix to construct the bi-partite graph, and therefore does not require the matrix to be complete.
Another advantage of the spectral co-clustering algorithm is that it can find clusters of different sizes and shapes. This is because the algorithm uses the eigenvectors of the graph Laplacian, which are sensitive to the local structure of the graph and can therefore identify clusters of different shapes and sizes.
Now that we have discussed the basics of the spectral co-clustering algorithm, let’s see how it can be implemented in Python using the Scikit-Learn library.
First, let’s start by importing the necessary libraries:
Python3
from sklearn import datasets
from sklearn.cluster import SpectralCoclustering
|
Next, let’s load the dataset that we will use for our clustering analysis. For this example, we will use the iris dataset, which is a well-known dataset that contains 150 data points representing three different species of iris flowers (setosa, versicolor, and virginica).
Python3
iris = datasets.load_iris()
X = iris.data
|
Now that we have our dataset, we can proceed with implementing the spectral co-clustering algorithm.
To perform spectral co-clustering, we first need to create an instance of the SpectralCoClustering class. This class takes several parameters, including the number of clusters to find (n_clusters) and the number of eigenvectors to use (n_components). For this example, we will set n_clusters to 3, since there are 3 species of the iris in the dataset.
Python3
clustering = SpectralCoclustering(n_clusters=3)
clustering.fit(X)
|
Once the spectral co-clustering algorithm has been applied to the dataset, we can use the row_labels_ and column_labels_ attributes to obtain the cluster labels for the rows and columns of the data matrix.
Python3
row_labels = clustering.row_labels_
column_labels = clustering.column_labels_
|
Finally, we can use cluster labels to visualize the clusters and the relationships between them.
Python3
import matplotlib.pyplot as plt
plt.scatter(X[:, 0], X[:, 1], c=row_labels)
plt.ylabel('Feature 2')
plt.xlabel('Feature 1')
plt.show()
|
This code will generate a scatter plot that shows the clusters and the relationships between them. The different colors in the plot represent the different clusters, with similar colors indicating data points that belong to the same cluster.
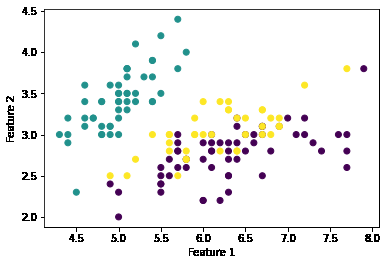
Clusters formed by the SpectralCoClustering Algorithm
Conclusion
In this article, we discussed the spectral co-clustering algorithm and how it can be used to find clusters in both rows and columns of a data matrix. We saw that a spectral co-clustering algorithm is a powerful tool for data analysis, as it can uncover hidden patterns and relationships in the data.
We also saw an example of how the spectral co-clustering algorithm can be implemented in Python using the Scikit-Learn library. By applying this algorithm to a dataset, we can find clusters in both rows and columns of the data matrix and visualize the relationships between them. This can be useful for identifying patterns and trends in the data.
Like Article
Suggest improvement
Share your thoughts in the comments
Please Login to comment...