Sort Correlation Matrix in Python
Last Updated :
26 Dec, 2020
Prerequisites: correlation matrix
A correlation matrix investigates the dependence between multiple variables at the same time. It shows symmetric tabular data where each row and column represent a variable, and the corresponding value is the correlation coefficient denoting the strength of a relationship between these two variables. There are many types of correlation coefficients (Pearson’s coefficient, Kendall’s coefficient, Spearman’s coefficient, etc.) which are computed by different methods of correlation analysis. The variables with correlation coefficient values closer to 1 show a strong positive correlation, the values closer to -1 show a strong negative correlation, and the values closer to 0 show weak or no correlation.
In data analysis, a correlation matrix is highly useful for summarizing and spotting relations in large amounts of data. It is also a common metric for exploratory data analysis and feature selection in machine learning.
Interpreting a correlation matrix can become difficult with large data. Sometimes sorting the correlation values helps to see the degree of dependence of various variable pairs easily. In this article, we will see how to sort a correlation matrix in Python.
Approach
- Import module
- Load data
- Create a correlation matrix using the above data
- Sort the data.
- Display sorted data
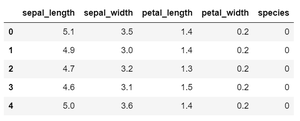
We will use the Iris data set from Python’s Seaborn package. The data set contains 3 classes of a type of iris flower having 50 instances of their attributes each. Note that a correlation matrix ignores any non-numeric column in the data. So, first change any non-numeric data that you want to include in your correlation matrix to numeric data using label encoding.
Now, to sort the correlation matrix, first we have to convert the matrix to one-dimensional series. The unstack() function is used to do so. The series will have multiple index.
For sorting sort_values() function is used. The sort_values() function sorts a data frame in Ascending or Descending order of passed Column.
Syntax: DataFrame.sort_values(by, axis=0, ascending=True, inplace=False, kind=’quicksort’, na_position=’last’)
Parameters:
- by: Single/List of column names to sort Data Frame by.
- axis: 0 or ‘index’ for rows and 1 or ‘columns’ for Column
- ascending: Boolean value which sorts Data frame in ascending order if True
- inplace: Boolean value. Makes the changes in passed data frame itself if True.
- kind: String which can have three inputs(‘quicksort’, ‘mergesort’ or ‘heapsort’) of algorithm used to sort data frame.
- na_position: Takes two string input ‘last’ or ‘first’ to set position of Null values. Default is ‘last’.
Return type: Returns a sorted Data Frame with Same dimensions as of the function caller Data Frame.
Dataframe in use:
Example 1:
Python3
import pandas as pd
import numpy as np
import seaborn as sns
import matplotlib.pyplot as plt
from sklearn.preprocessing import LabelEncoder
df = sns.load_dataset('iris')
label_encoder = LabelEncoder()
df['species'] = label_encoder.fit_transform(df['species'])
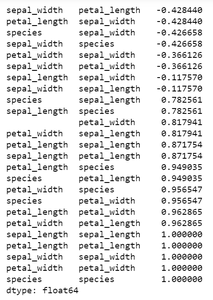
corr_mat = df.corr(method='pearson')
sorted_mat = corr_mat.unstack().sort_values()
print(sorted_mat)
|
Output:
Example 2: Sort correlation matrix without duplicates
In order to remove duplicate and self-correlation values, get the upper or lower triangular values of the matrix before converting the correlation matrix to one-dimensional series. For this purpose triu() function is used which returns an upper triangular matrix with the shape of the correlation matrix (Value 1 for elements above the main diagonal and 0 for others). The method astype() converts the matrix values to boolean. This is where the function can select arrays based on another conditional array so the result we get is a matrix with upper triangular values of the correlation matrix and the remaining values are null.
Then the correlation matrix is converted to the one-dimensional array to be sorted as done in the example above. Implementation is given below:
Python3
import pandas as pd
import numpy as np
import seaborn as sns
import matplotlib.pyplot as plt
from sklearn.preprocessing import LabelEncoder
df = sns.load_dataset('iris')
label_encoder = LabelEncoder()
df['species'] = label_encoder.fit_transform(df['species'])
corr_mat = df.corr(method='pearson')
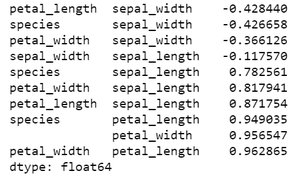
upper_corr_mat = corr_mat.where(
np.triu(np.ones(corr_mat.shape), k=1).astype(np.bool))
unique_corr_pairs = upper_corr_mat.unstack().dropna()
sorted_mat = unique_corr_pairs.sort_values()
print(sorted_mat)
|
Output:
Like Article
Suggest improvement
Share your thoughts in the comments
Please Login to comment...