Sort Boxplot by Mean with Seaborn in Python
Last Updated :
01 Nov, 2022
Seaborn is an amazing visualization library for statistical graphics plotting in Python. It provides beautiful default styles and color palettes to make statistical plots more attractive. It is built on the top of matplotlib library and also closely integrated to the data structures from pandas.
Box Plot is the visual representation of the depicting groups of numerical data through their quartiles. Boxplot is also used for detecting the outlier in data set. It captures the summary of the data efficiently with a simple box and whiskers and allows us to compare easily across groups. Boxplot summarizes sample data using 25th, 50th, and 75th percentiles. These percentiles are also known as the lower quartile, median and upper quartile.
Sometimes, we want to order the boxplots according to our needs there are many ways you can order a boxplot that are:
- Order of boxplot manually
- Sorting of boxplot using mean
In this article, we will discuss how to order a boxplot using mean.
What sort boxplot using mean?
When we have multiple groups it’s suggested to use sorting by mean or median manually it will get difficult to sort.
Step-by-step Approach:
Python3
import numpy as np
import pandas as pd
import seaborn as sns
import matplotlib.pyplot as plt
|
Python3
df = pd.DataFrame({
'Ice-cream': np.random.normal(57, 5, 100),
'Chocolate': np.random.normal(73, 5, 100),
'cupcake': np.random.normal(68, 8, 100),
'jamroll': np.random.normal(37, 10, 100),
'cake': np.random.normal(76, 5, 100),
})
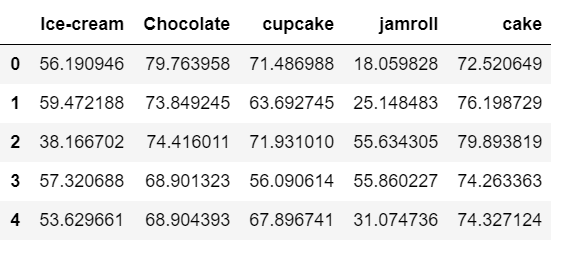
df.head()
|
Output:
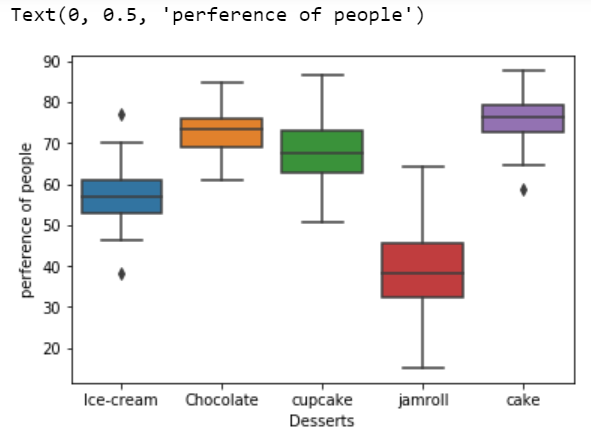
- Plot the data before sorting the boxplot.
Python3
sns.boxplot(data=df)
plt.xlabel('Desserts')
plt.ylabel('preference of people')
|
Output:
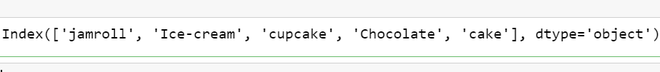
- Now sort the data first and get the sorted indices as we have to sort the boxplot using mean, so we will apply the mean() and sort_values function to the data.
Python3
index_sort = df.mean().sort_values().index
index_sort
|
Output:
- Using sorted index we can sort the data frame that we created.
Python3
df_sorted = df[index_sort]
|
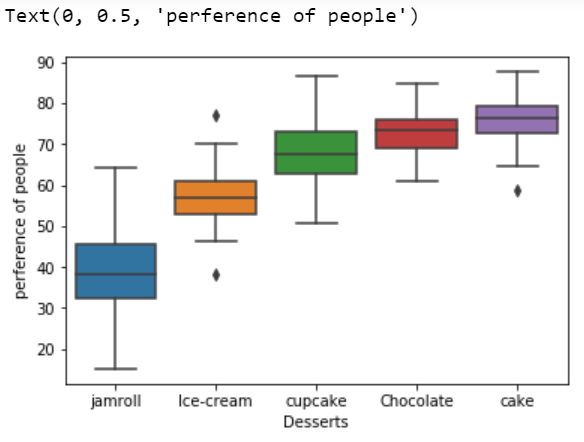
So We have sorted the data let’s plot the boxplot of the data.
Python3
sns.boxplot(data = df_sorted)
plt.xlabel('Desserts')
plt.ylabel('preference of people')
|
Output:
If one wants to sort in descending order then use the below syntax:
index_sort = df.mean().sort_values(ascending=False).index
Below is the complete program based on the above approach:
Python3
import numpy as np
import pandas as pd
import seaborn as sns
import matplotlib.pyplot as plt
df = pd.DataFrame({
'Ice-cream': np.random.normal(57, 5, 100),
'Chocolate': np.random.normal(73, 5, 100),
'cupcake': np.random.normal(68, 8, 100),
'jamroll': np.random.normal(37, 10, 100),
'cake': np.random.normal(76, 5, 100),
})
index_sort = df.mean().sort_values().index
df_sorted = df[index_sort]
sns.boxplot(data = df_sorted)
plt.xlabel('Desserts')
plt.ylabel('preference of people')
|
Output:
Like Article
Suggest improvement
Share your thoughts in the comments
Please Login to comment...