Smem Tool To Display Memory Usage More Accurate in Linux
Last Updated :
14 Feb, 2022
Multiple tools are available to monitor the memory usage on a Linux system. Memory management by monitoring memory usage is one of the important things to do on our Linux system, Smem is one of the memory usage monitoring tools available in Linux. Smem displays the memory usage of the processes on the command line, smem also displays a Graphical Output using color-coded pie and/or bar chart. With smem, we can easily visualize memory use on our system.
Installing Smem:
On Debian/Ubuntu smem can be installed from the repositories by using the following command:
sudo apt-get install smem
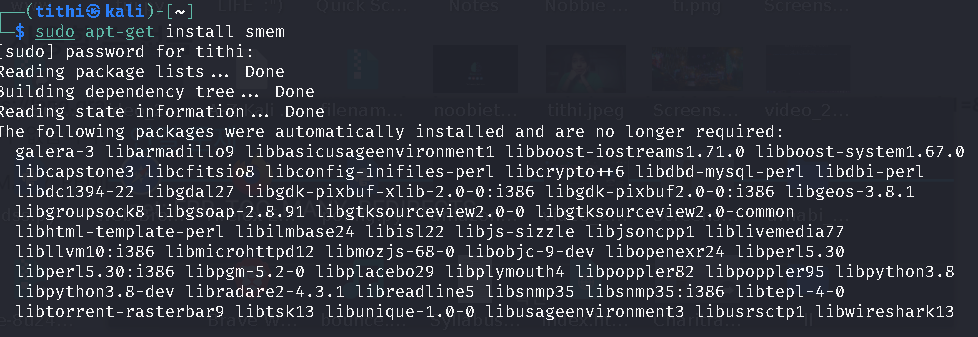
sudo apt-get install smem
Command-Line Options:
After we are done with the installation, we can run smem as a normal user, it displays memory usage by a process that the particular user has started, the processes are arranged in order of increasing PSS. Now we can get a report of the memory consumed by all processes launched with the current user ID, Swap, USS (Unique Set Size–this portion is occupied by a process which is a part of the main memory and that is private), PSS (Proportional Set Size—this portion is occupied by a process which is a part of the main memory and composed by private memory), and RSS (Resident Set Size–the portion of memory that is occupied by a process in main memory) in increasing order. This command gives a report on all running PIDs just by typing the following command in the terminal:
smem
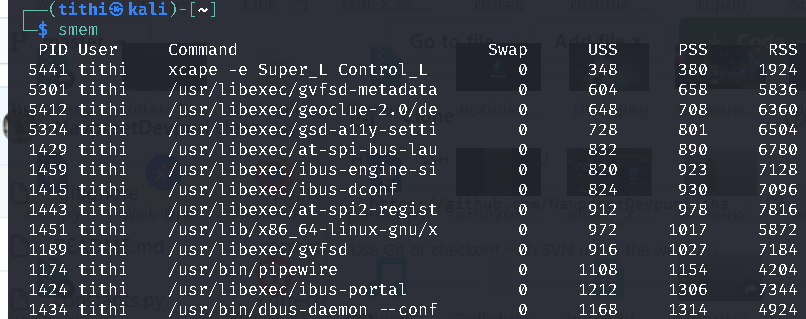
unprivileged user report
You can also run smen as a superuser to view the report of memory usage by all the system users, across the whole system by using the following command:
sudo smem
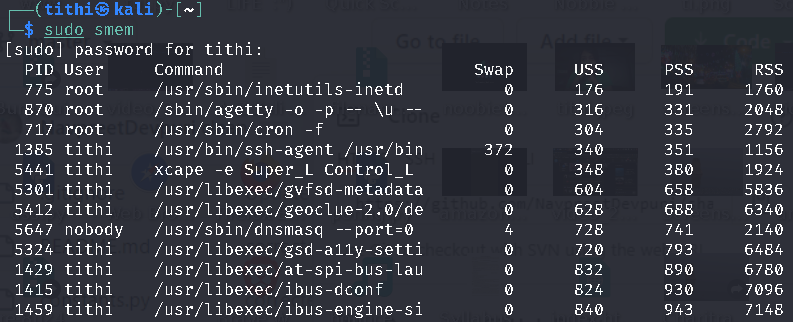
privileged user report
There are many more options that can be invoked while using smem, you can check that out in smen manual by using the following command :
man smen
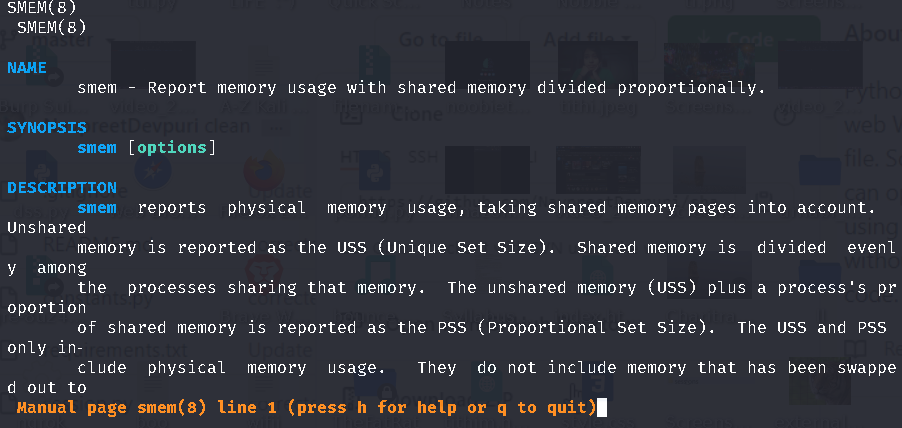
smen manual
Generating Graphical Output:
We can generate graphical output by generating a graphical chart to show memory usage. But we need the following to be installed beforehand:
- Python (2.4 or above)
- matplotlib library: It is used to generate the charts.
Ubuntu/Debian users can get matplotlib by running the following command :
sudo apt-get install python-matplotlib
Installing python-matplotlib
Once you have installed them, you can now get a visual representation of memory usage in the following form:
- pie chart
- bar graph.
Using pie chart:
With a pie chart you are able to view the memory usage(USS, PSS, and RSS) in form of a pie chart by using the following command:
smem --pie name -s uss
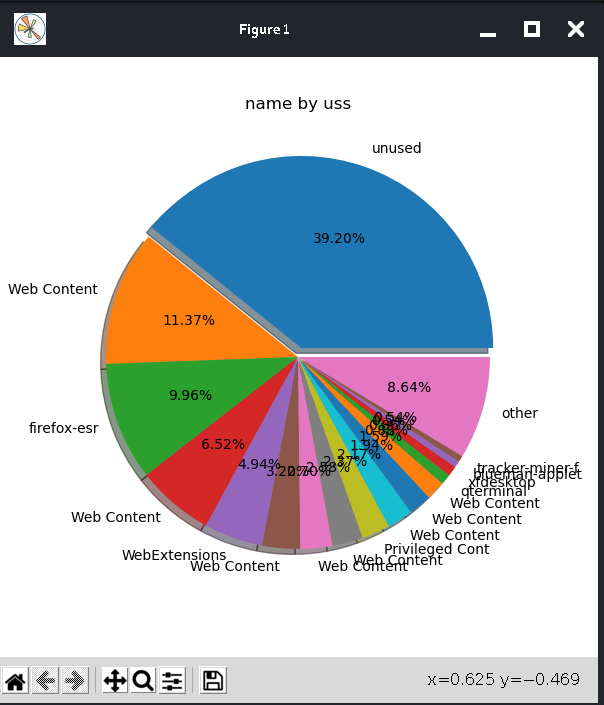
pie chart
The above screenshot generated a pie chart showing memory usage by USS. To get the PSS and RSS, simply we can replace USS with PSS or RSS in the above command.
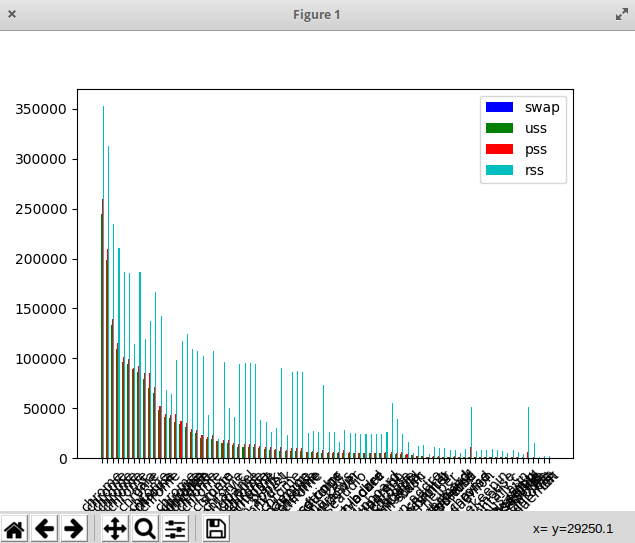
And also you can generate a bar graph using the –bar command to get a bar graph.
smem --bar name -s uss
Like Article
Suggest improvement
Share your thoughts in the comments
Please Login to comment...