sklearn.cross_decomposition.PLSRegression() function in Python
Last Updated :
03 Jun, 2021
PLS regression is a Regression method that takes into account the latent structure in both datasets. Partial least squares regression performed well in MRI-based assessments for both single-label and multi-label learning reasons. PLSRegression acquires from PLS with mode=”A” and deflation_mode=”regression”. Additionally, known PLS2 or PLS in the event of a one-dimensional response.
Syntax: class sklearn.cross_decomposition.PLSRegression(n_components=2, *, scale=True, max_iter=500, tol=1e-06, copy=True)
Parameters:
This function accepts five parameters which are mentioned above and defined below:
- n_components:<int>: Its default value is 2, and it accepts the number of components that are needed to keep.
- scale:<bool>: Its default value is True, and it accepts whether to scale the data or not.
- max_iteran :<int>: Its default value is 500, and it accepts the maximum number of iteration of the NIPALS inner loop.
- tol: <non-negative real>: Its default value is 1e-06, and it accepts tolerance used in the iterative algorithm.
- copy:<bool>: Its default value is True, and it shows that deflection should be done on a copy. Don’t care about side effects when the default value is set True.
Return Value: PLSRegression is an approach for predicting response.
The below Example illustrates the use of the PLSRegression() Model.
Example:
Python3
import numpy as np
import pandas as pd
from sklearn import datasets
import matplotlib.pyplot as plt
from sklearn.cross_decomposition import PLSRegression
from sklearn.model_selection import train_test_split
boston = datasets.load_boston()
x = boston.data
y = boston.target
df_x = pd.DataFrame(x, columns=boston.feature_names)
df_y = pd.DataFrame(y)
pls2 = PLSRegression(n_components=2)
x_train, x_test, y_train, y_test = train_test_split(
df_x, df_y, test_size=0.30, random_state=1)
pls2.fit(x_train, y_train)
Y_pred = pls2.predict(x_test)
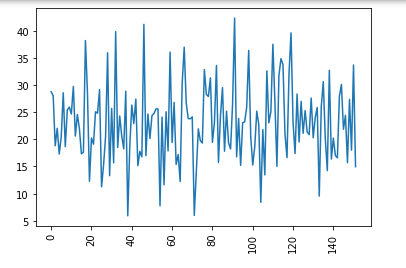
plt.plot(Y_pred)
plt.xticks(rotation=90)
plt.show()
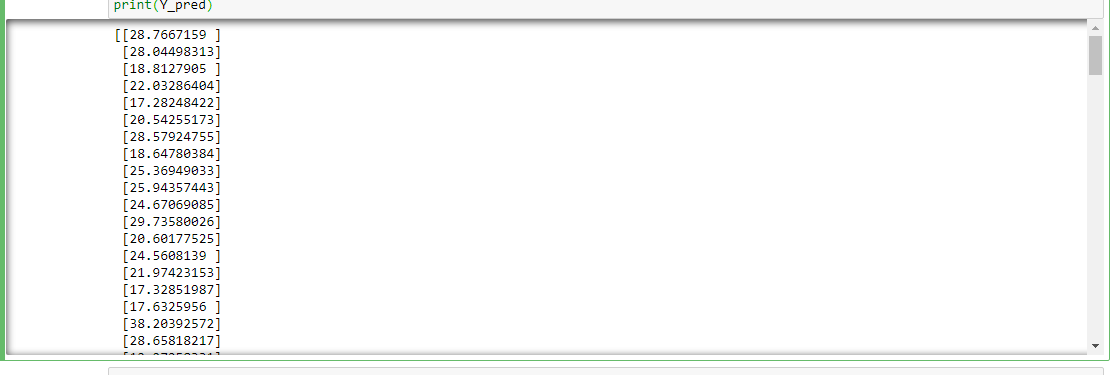
print(Y_pred)
|
Output:
Plot the Predicted value using PLSRegression
Print the predicted value using trained model
Like Article
Suggest improvement
Share your thoughts in the comments
Please Login to comment...