Show Me in Tableau
Last Updated :
22 Oct, 2020
In this article, we will see Show Me option and features associated with it in Tableau.
- Tableau: Tableau is a very powerful data visualization tool that can be used by data analysts, scientists, statisticians, etc. to visualize the data and get a clear opinion based on the data analysis. Tableau is very famous as it can take in data and produce the required data visualization output in a very short time.
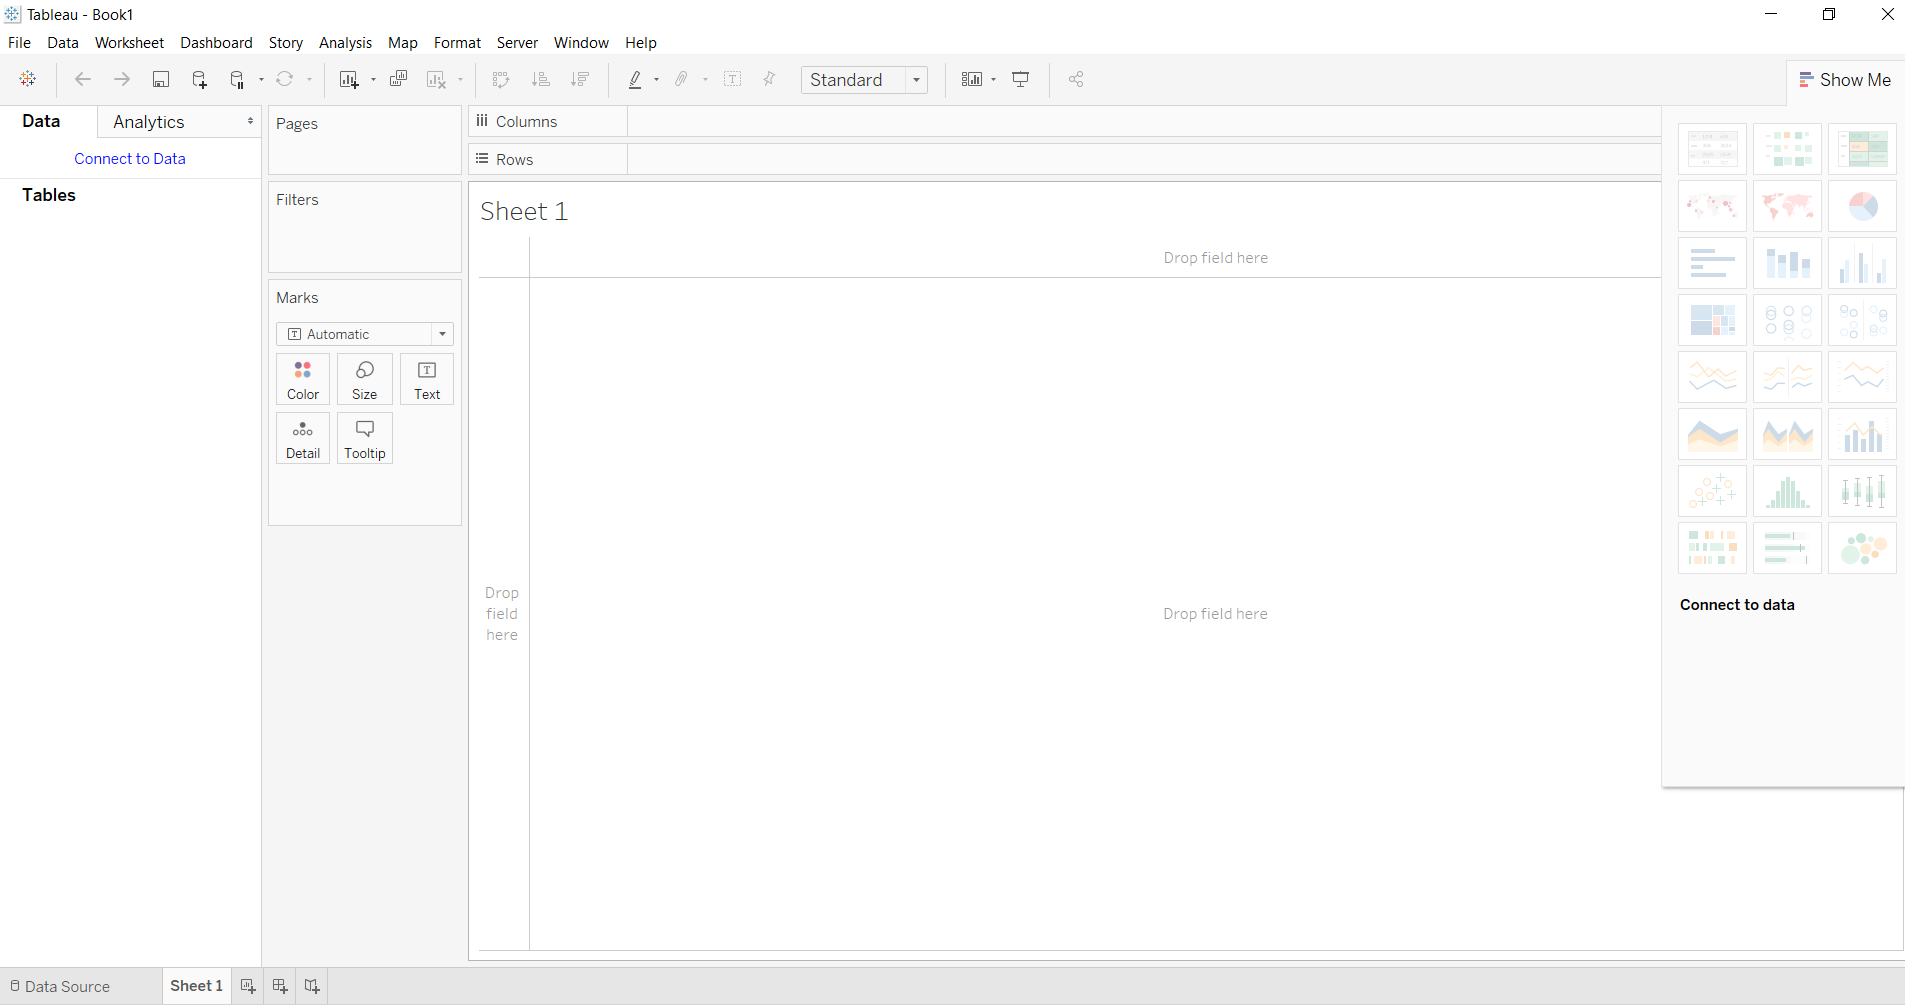
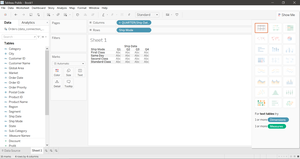
- Show Me: Show Me window holds the most commonly used charts in Tableau. You can use any of these charts to view the data. Click Show Me on the toolbar to open this window, as we have shown below.
Steps to generate various illustrations from Show Me window in Tableau:
- Open Tableau tool and click on Show start Page.
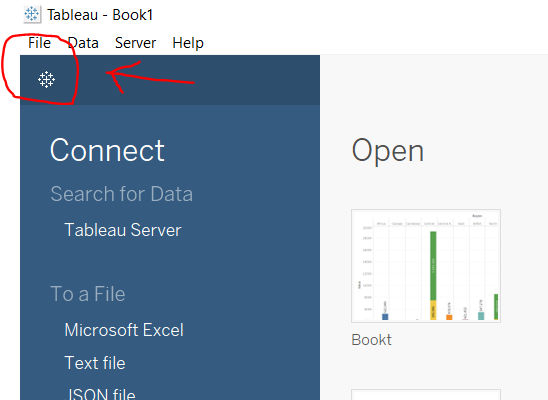
- Click on Show Me Option to view features.
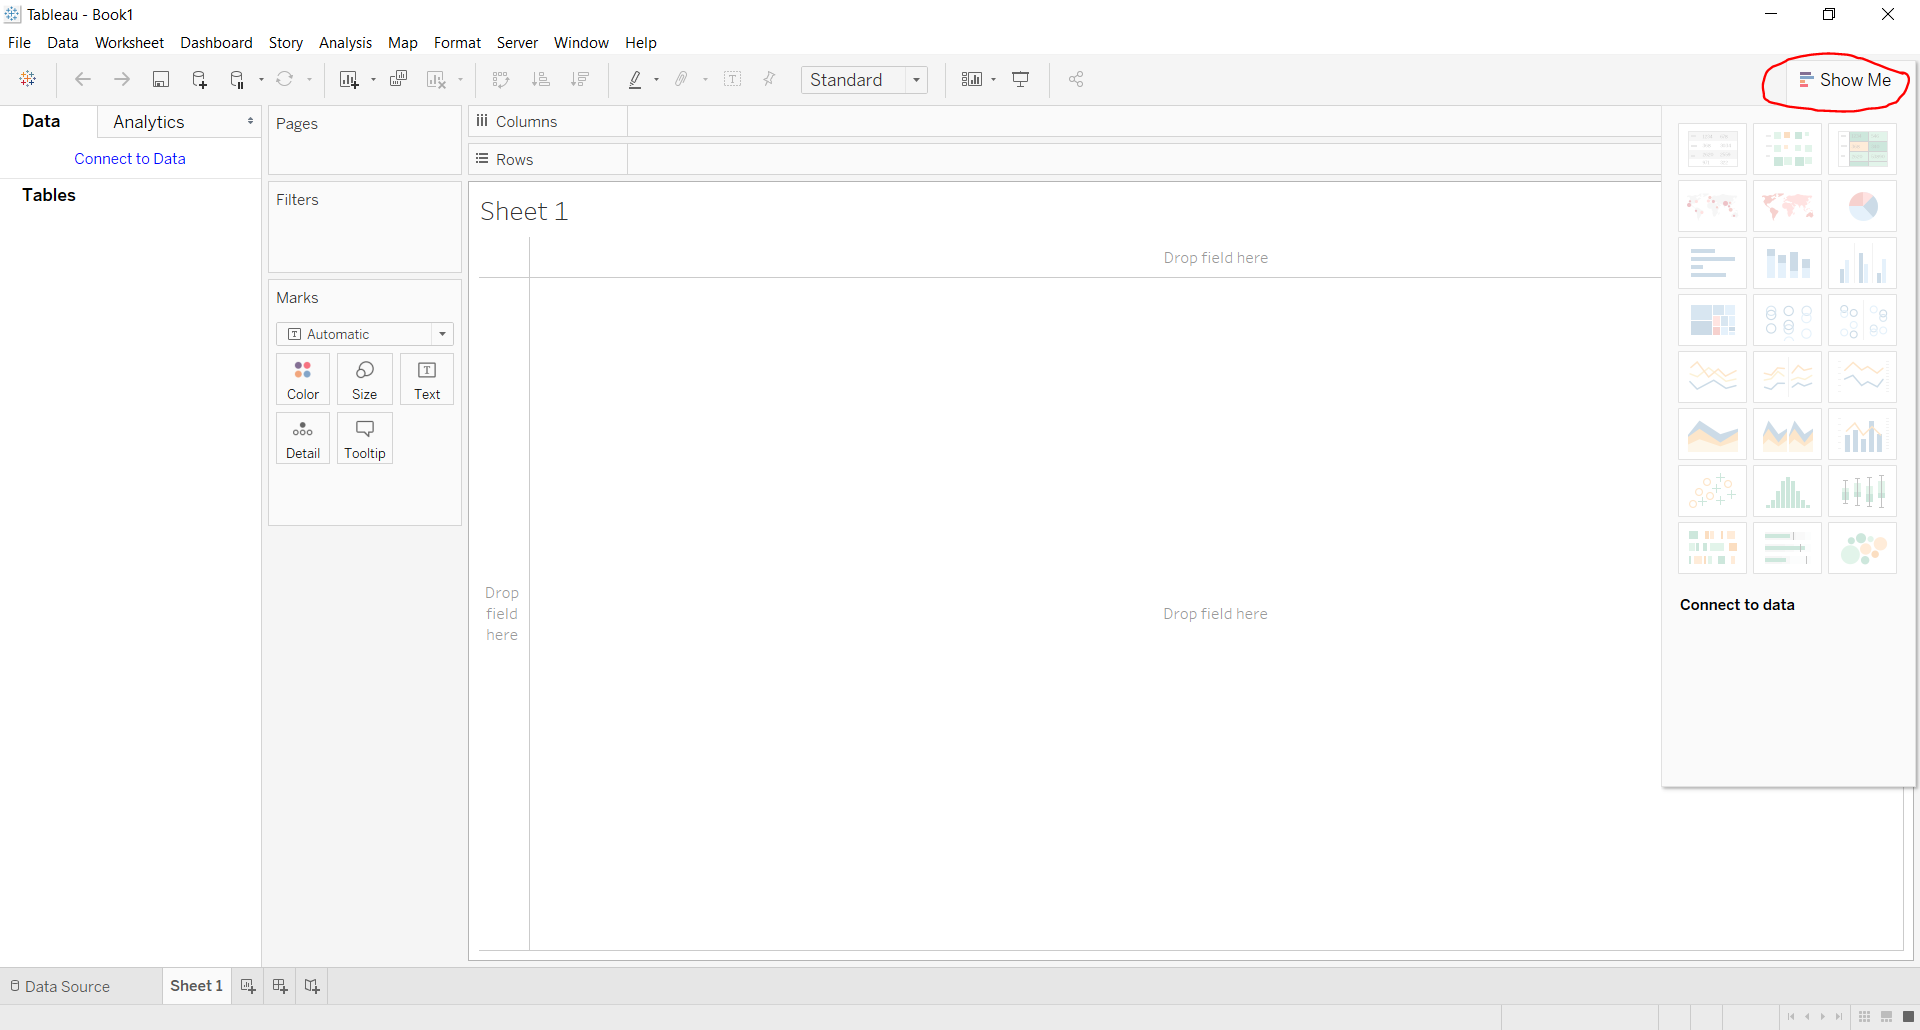
Here you will get different types of charts and graphs listed below:
| Text Label |
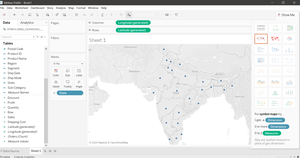
Symbol Maps |
Horizontal Bars |
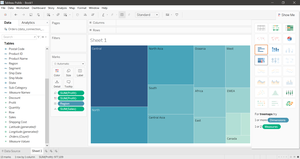
Tree Map |
| Heat Map |
Maps |
Stacked Bars |
Circle Views |
| Highlight Table |
Pie Charts |
Side-by-Side Bars |
Side-by-Side Circle Views |
| Line Chart |
Discrete Lines |
Dual Lines |
Area Chart |
| Discrete Area Chart |
Dual Combination Chart |
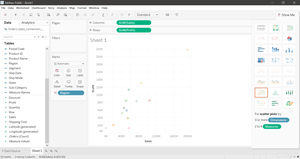
Scatter Plot |
Histograms |
| Box and Whisker Plots |
Gantt Chart |
Bullet Graph |
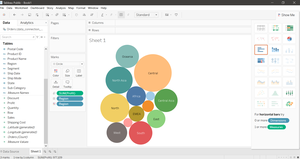
Packed Bubbles Chart |
To use different graphs and charts one should follow some steps:
- Hover over a graph/ chart you want to use.
- See the requirements
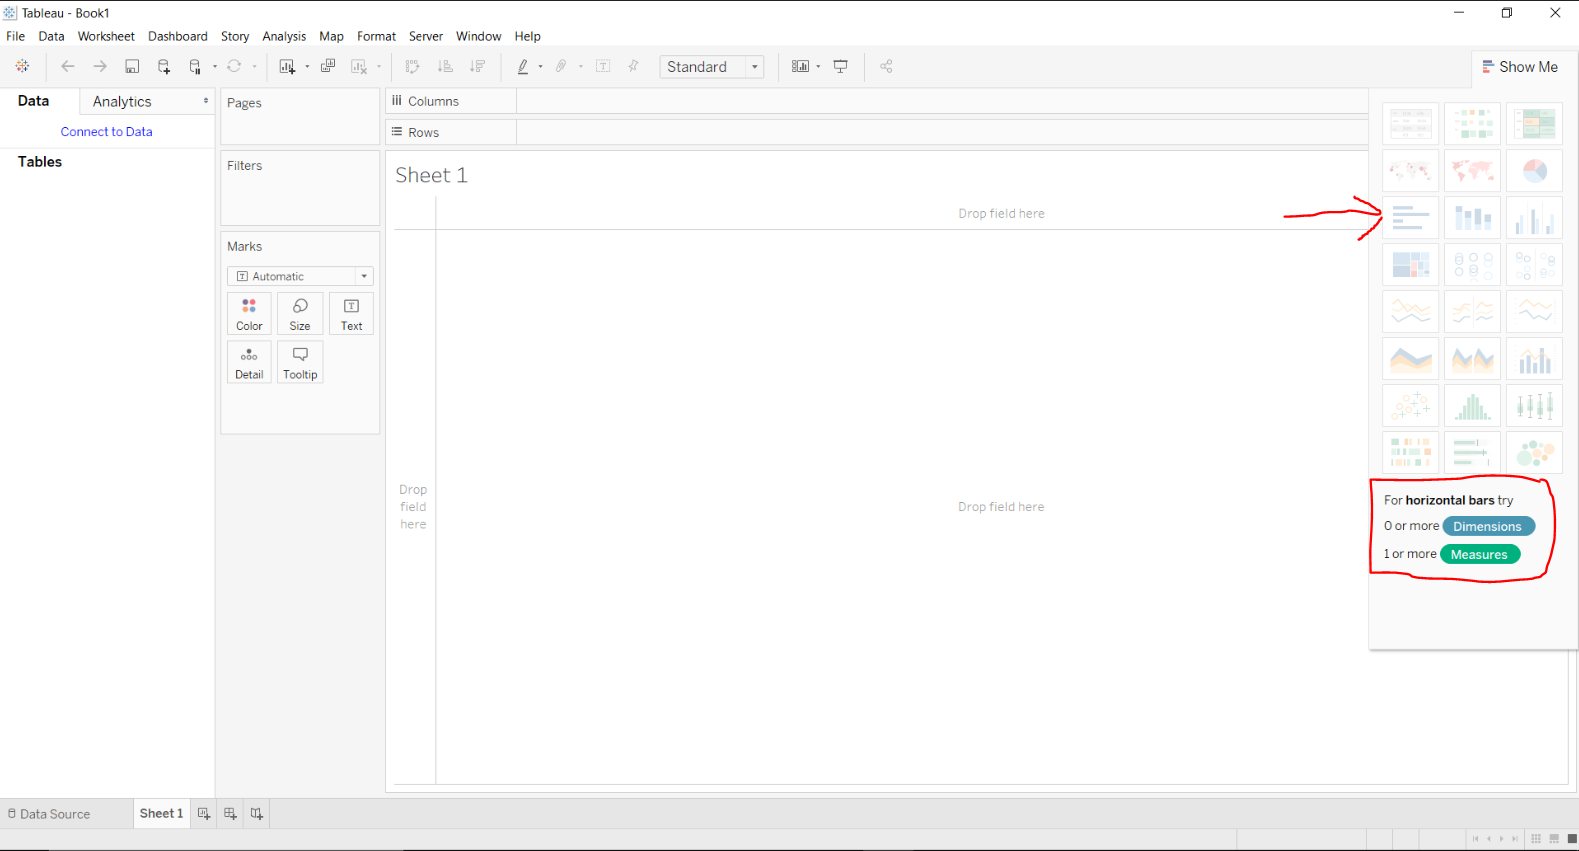
- Fulfill the requirements
- At last click on it.
In this way, one can use any feature of Show Me option in Tableau.
Below are some illustrations which can be generated from the Show Me window:
Like Article
Suggest improvement
Share your thoughts in the comments
Please Login to comment...