Short Note on Gantt Chart
Last Updated :
21 Dec, 2022
Generalized Activity Normalization Time Table (GANTT) chart is type of chart in which series of horizontal lines are present that show the amount of work done or production completed in given period of time in relation to amount planned for those projects. It is horizontal bar chart developed by Henry L. Gantt (American engineer and social scientist) in 1917 as production control tool. It is simply used for graphical representation of schedule that helps to plan in an efficient way, coordinate, and track some particular tasks in project.
The purpose of Gantt chart is to emphasize scope of individual tasks. Hence set of tasks is given as input to Gantt chart. Gantt chart is also known as timeline chart. It can be developed for entire project or it can be developed for individual functions. In most of projects, after generation of timeline chart, project tables are prepared. In project tables, all tasks are listed in proper manner along with start date and end date and information related to it.
Gantt chart represents following things :
- All the tasks are listed at leftmost column.
- The horizontal bars indicate or represent required time by corresponding particular task.
- When occurring of multiple horizontal bars takes place at same time on calendar, then that means concurrency can be applied for performing particular tasks.
- The diamonds indicate milestones.
Advantages :
- Simplify Project –
Gantt charts are generally used for simplifying complex projects.
- Establish Schedule –
It simply establishes initial project schedule in which it mentions who is going to do what, when, and how much time it will take to complete it.
- Provide Efficiency –
It brings efficiency in planning and allows team to better coordinate project activities.
- Emphasize on scope –
It helps in emphasizing i.e., gives importance to scope of individual tasks.
- Ease at understanding –
It makes it easy for stakeholders to understand timeline and brings clarity of dates.
- Visualize project –
It helps in clearly visualizing project management, project tasks involved.
- Organize thoughts and Highly visible –
It organizes your thoughts and can be highly visible so that everyone in enterprises can have basic level of understanding and have knowledge about what’s happening in project even if they are not involved in working.
- Make Practical and Realistic planning –
It makes the project planning practical and realistic as realistic planning generally helps to avoid any kind of delays and losses of many that can arise.
Disadvantages :
- Sometimes, using Gantt chart makes project more complex.
- The size of bar chart dost not necessarily indicate amount of work done in project.
- Gantt charts and projects are needed to be updated on regular basis.
- It is not possible or difficult to view this chart on one sheet of paper. The software products that produce Gantt chart needed to be viewed on computer screen so that whole project can be seen easily.
Applications :
There are several professions, where use of gantt chart is very beneficial. Some of them are given below:
- Advertising Manager –
Advertising Managers generally controls and supervises end result of advertising companies, scheduling advertisements in different media, etc.
- Operations Manager –
Operations Managers generally control and handle resources that are essential for company operations.
- Project Manager –
Project Managers generally motivates project teams, collaborate with team members, schedule task and complete that on time, and report to stakeholders, etc.
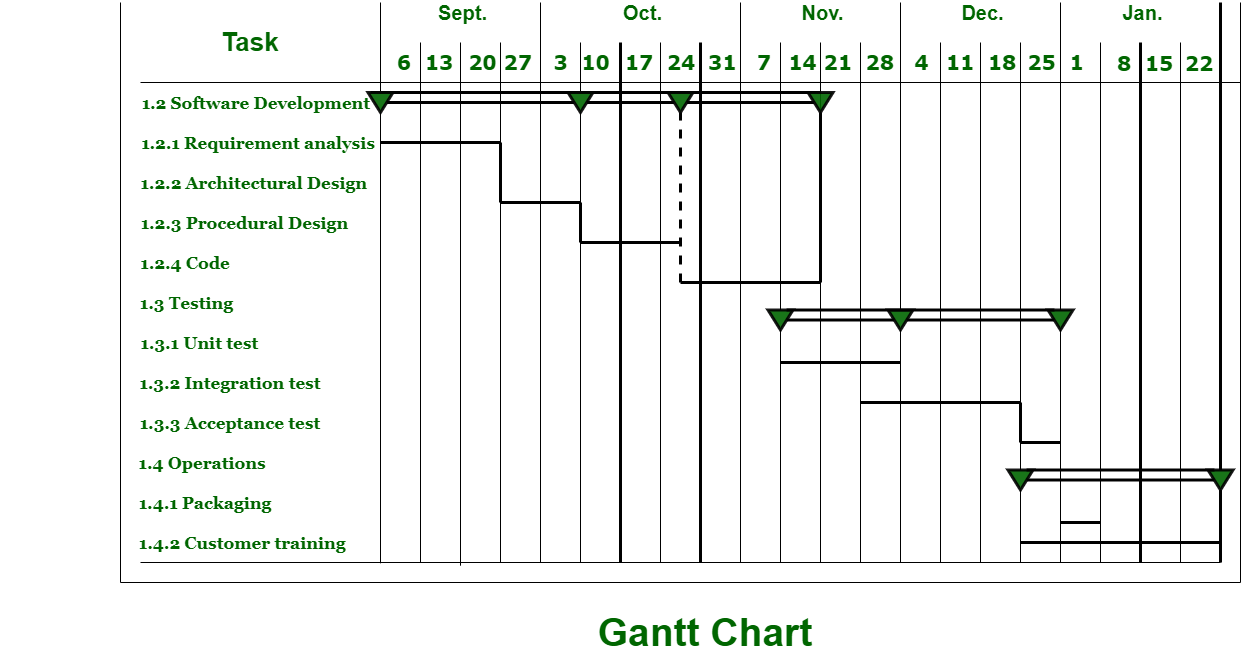
Example :
Nowadays, there are many companies and teams that use Gantt chart to plan, schedule, and execute their projects. Some of them are consulting agencies, manufacturing companies, Marketing teams, Construction companies, etc. Below is an example of Gantt chart:
Like Article
Suggest improvement
Share your thoughts in the comments
Please Login to comment...