Setting up Environment for Machine Learning with R Programming
Last Updated :
22 Jul, 2020
Machine Learning is a subset of Artificial Intelligence (AI), which is used to create intelligent systems that are able to learn without being programmed explicitly. In machine learning, we create algorithms and models which is used by an intelligent system to predict outcomes based on particular patterns or trends which are observed from the given data. Machine learning follows a unique principle of using data and the outcomes from the data to predict the rules which are stored in a model. This model is then used to predict outcomes from a different set of data. In R programming the environment for machine learning can be set easily through RStudio.
Setting up an environment for machine learning using Anaconda
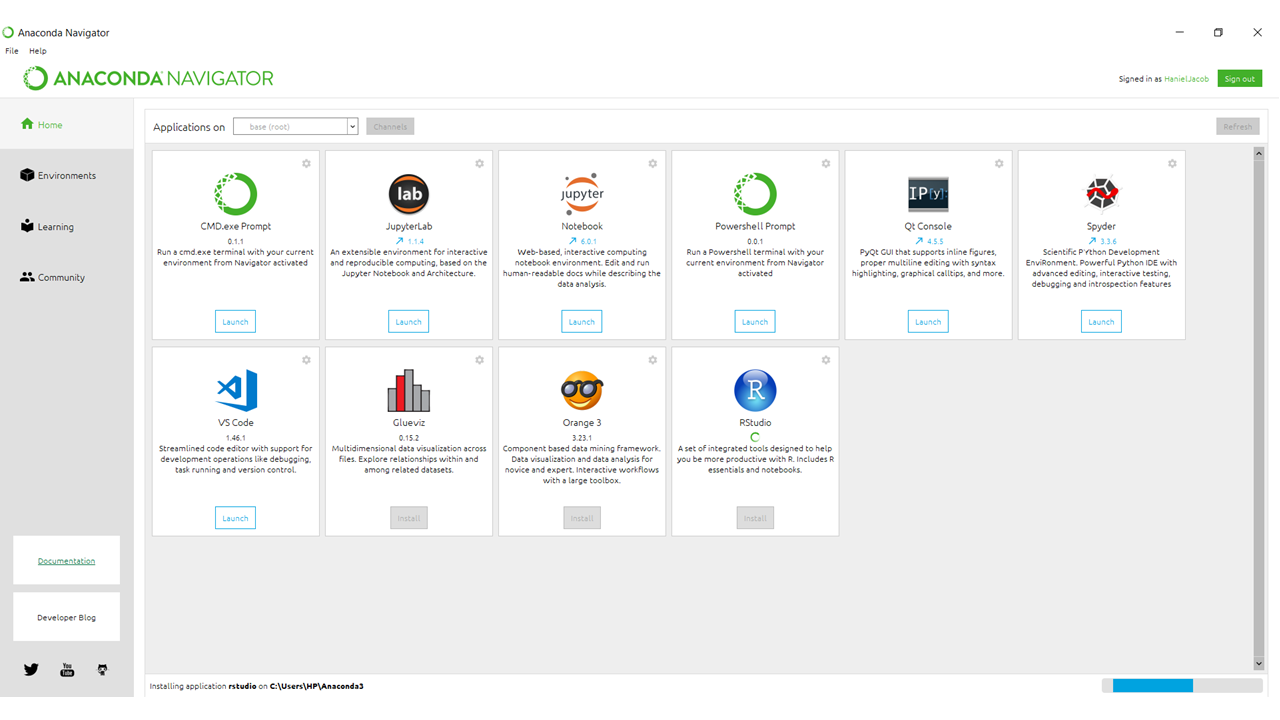
Step 1: Install Anaconda (Linux, Windows) and launch the navigator.
Step 2: Open Anaconda Navigator and click the Install button for Rstudio.
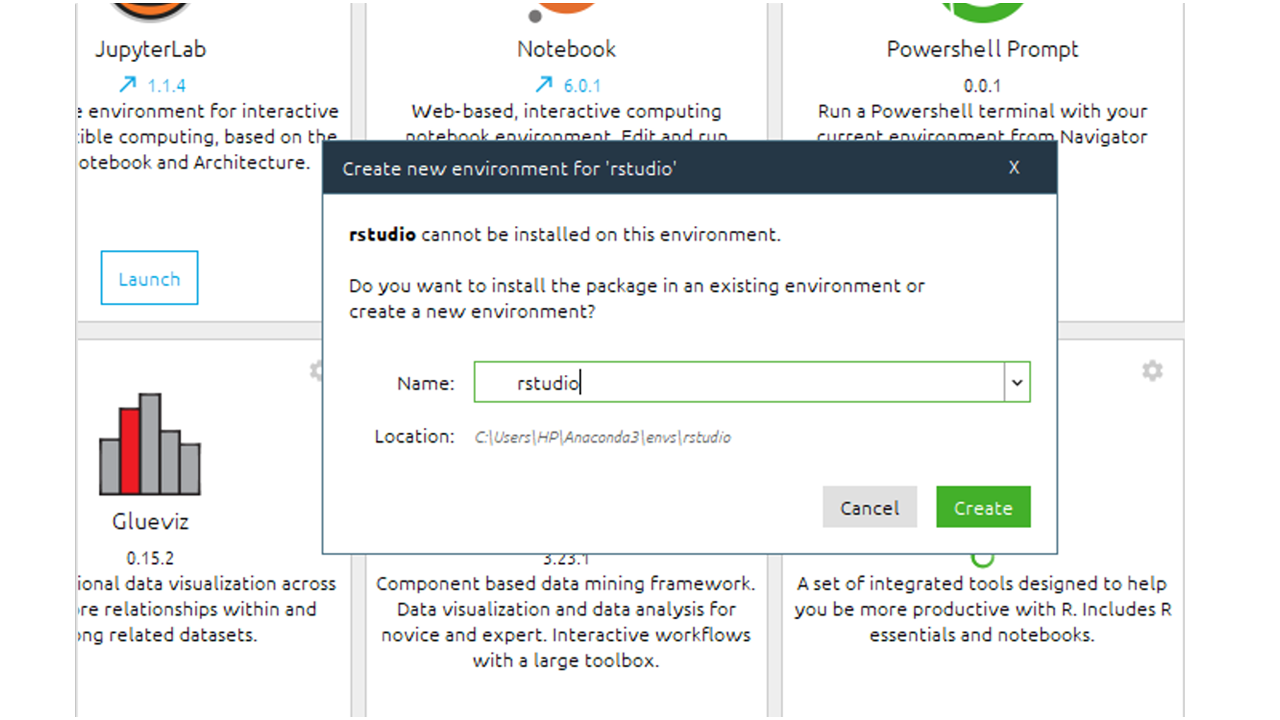
Step 3: After installation, create a new environment. Anaconda will then send a prompt asking to enter a name for the new environment and the lunch the R studio.
Running R commands
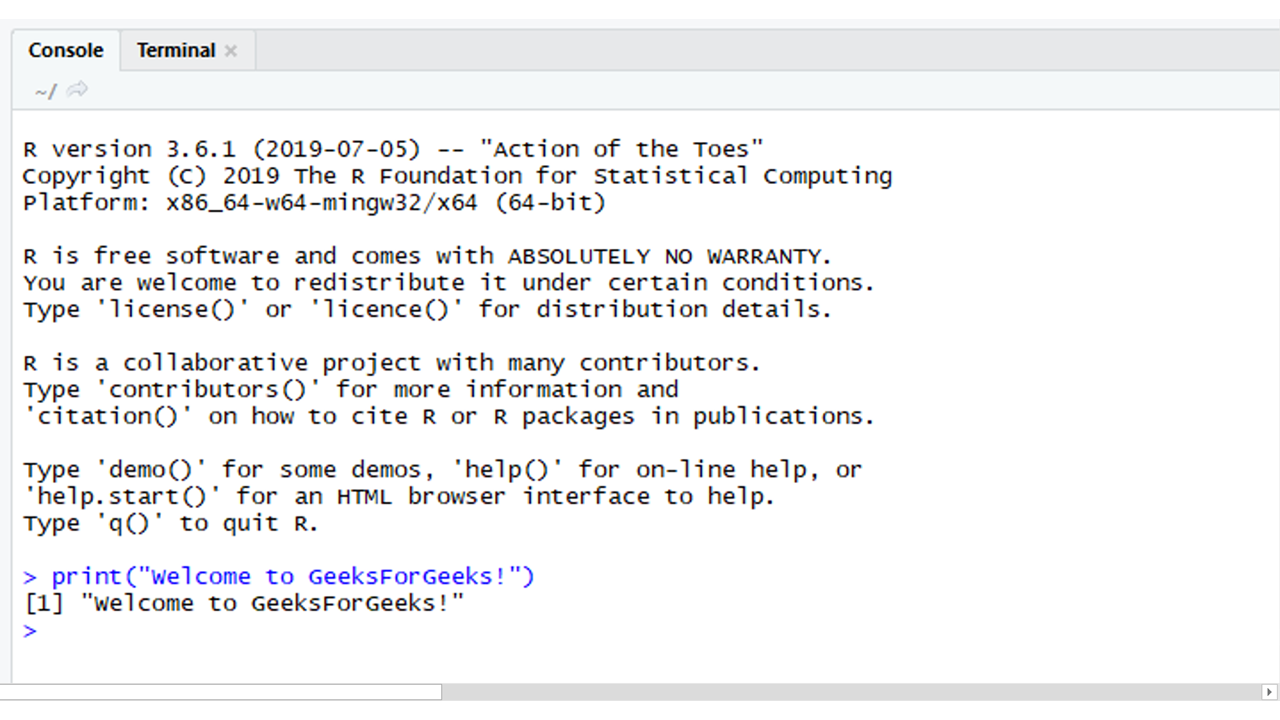
Method 1: R commands can run from the console provided in R studio. After opening Rstudio simply type R commands to the console.
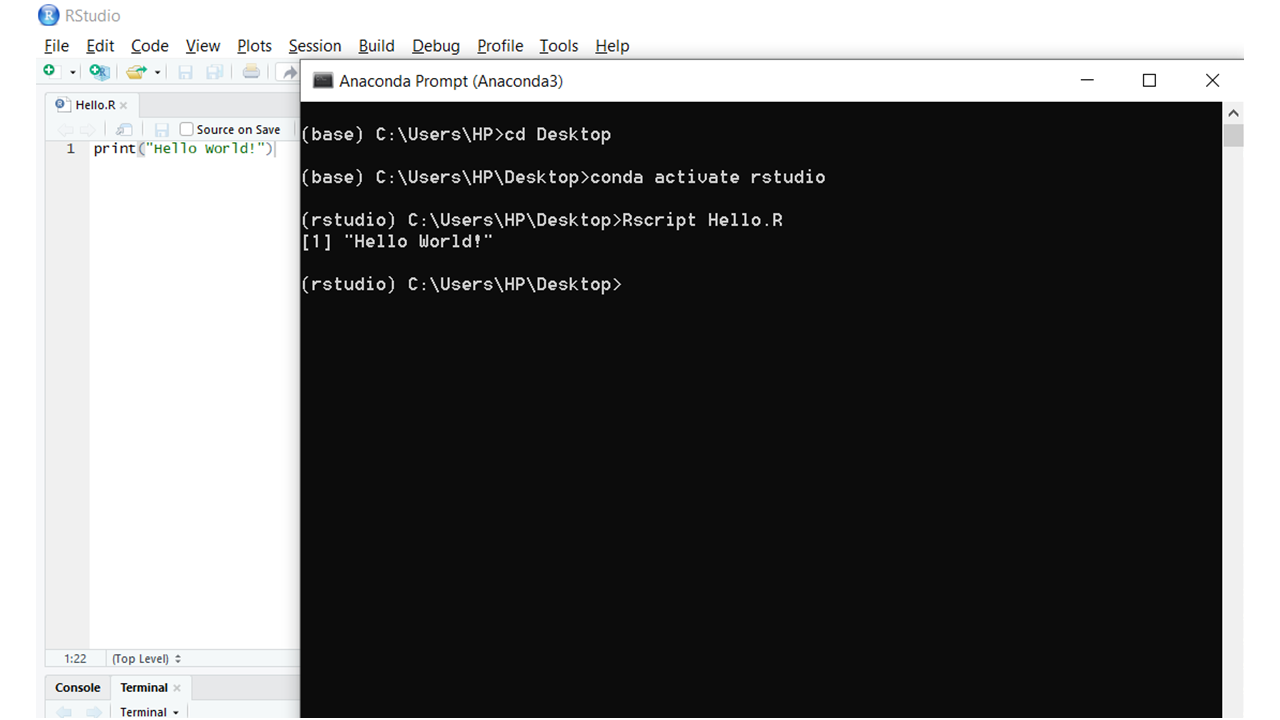
Method 2: R commands can be stored in a file and can be executed in an anaconda prompt. This can be achieved by the following steps.
- Open an anaconda prompt
- Go to the directory where the R file is located
- Activate the anaconda environment by using the command:
conda activate <ENVIRONMENT_NAME>
- Run the file by using the command:
Rscript <FILE_NAME>.R
Installing machine learning packages in R
Packages help make code easier to write as they contain a set of predefined functions that perform various tasks. The most used machine learning packages are Caret, e1071, net, kernlab, and randomforest. There are two methods that can be used to install these packages for your R program.
Method 1: Installing Packages through Rstudio
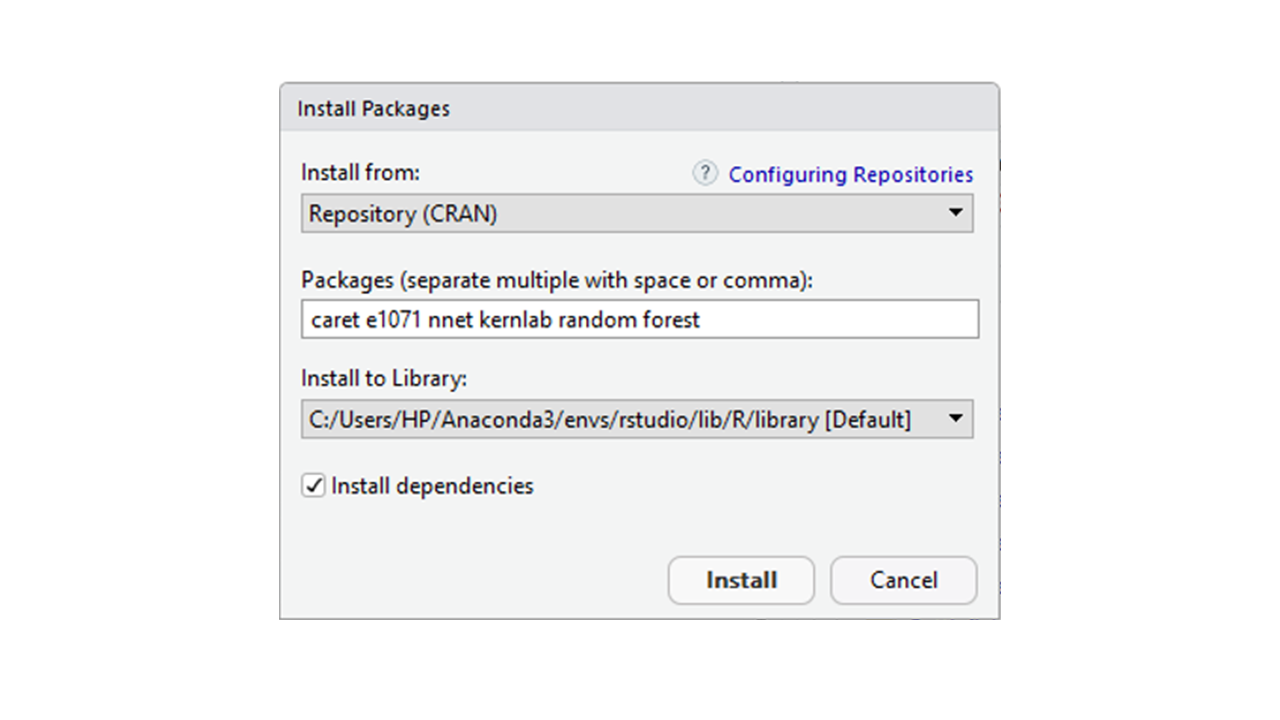
- Open Rstudio and click the Install Packages option under Tools which is present in the menubar.
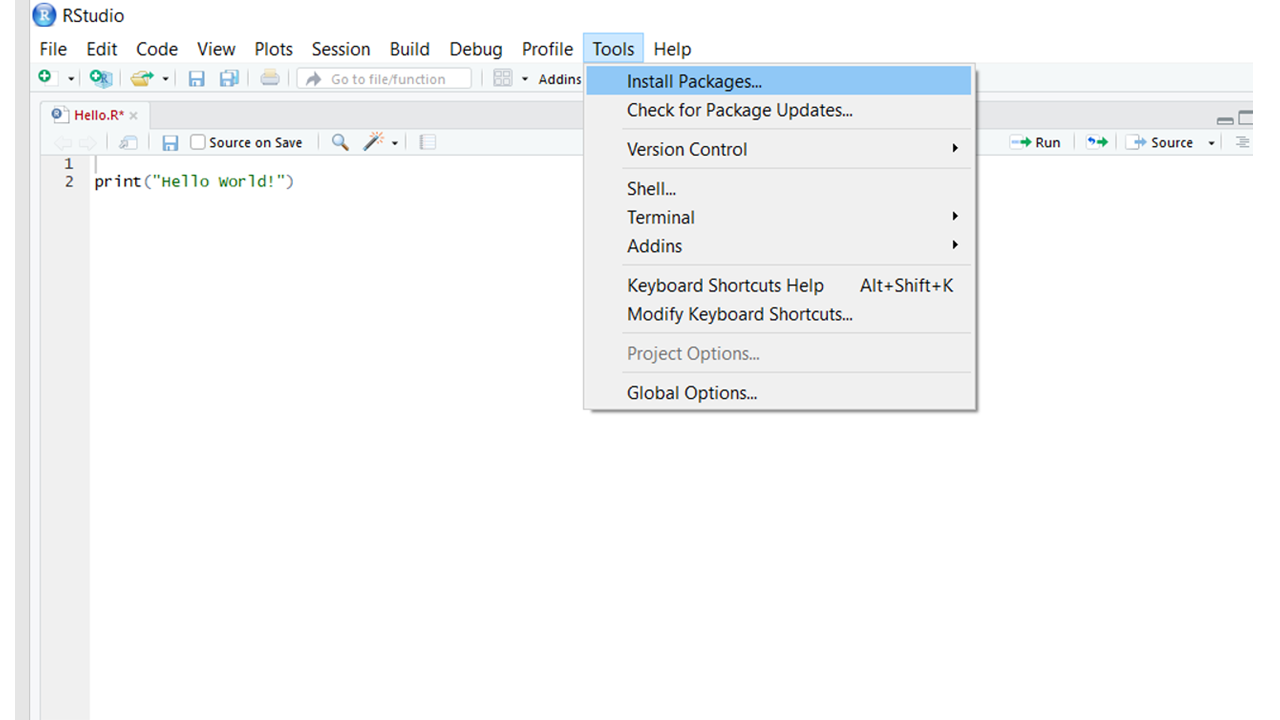
- Enter the names of all the packages you want to install separated by spaces or commas and then click install.
Method 2: Installing Packages through Anaconda prompt/Rstudio console
- Open an Anaconda prompt.
- Switch the environment to the environment you used for Rstudio using the command:
conda activate <ENVIRONMENT_NAME>
- Enter the command r to open the R console.
- Install the required packages using the command:
install.packages(c("<PACKAGE_1>", "<PACKAGE_2>", ..., "<PACKAGE_N>"))
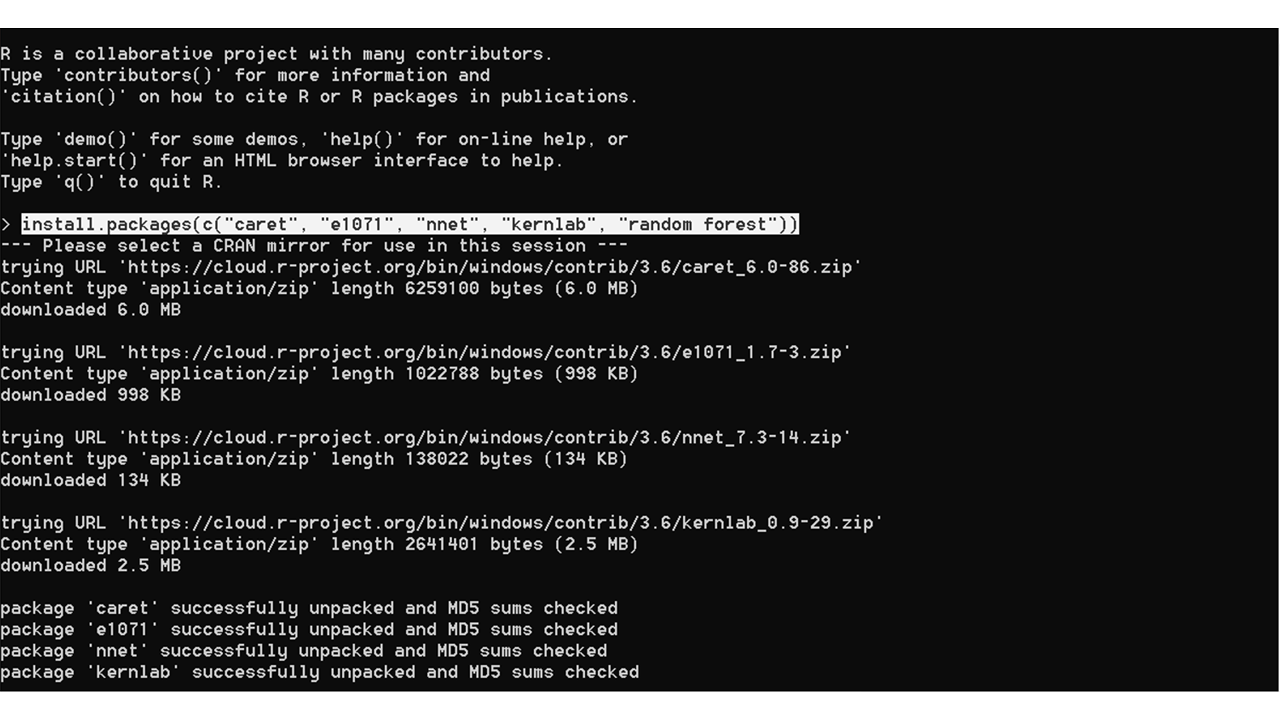
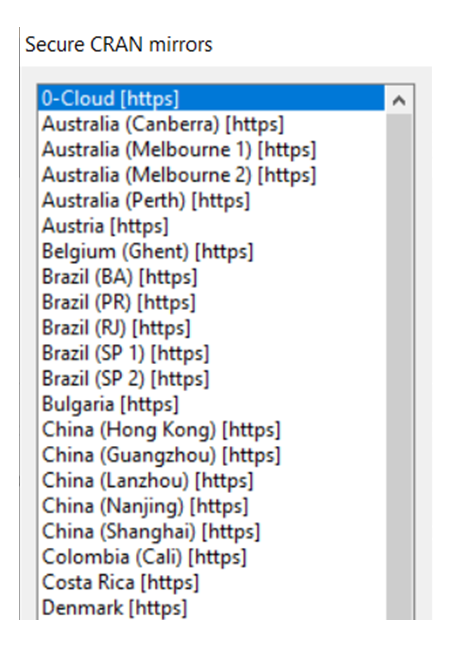
While downloading the packages you might be prompted to choose a CRAN mirror. It is recommended to choose the location closest to you for a faster download.
Machine Learning packages in R
There are many R libraries that contain a host of functions, tools, and methods to manage and analyze data. Each of these libraries has a particular focus with some libraries managing image and textual data, data manipulation, data visualization, web crawling, machine learning, and so on. Here let’s discuss some of the important machine learning packages by demonstrating an example.
Example:
Preparing the Data Set:
Before using these packages first of all import the data set into RStudio, cleaning the data set, and split the data into train and test data set. Download the CSV file from this link.
Data <- read.csv("GenderClassification.csv",
stringsAsFactors = TRUE)
set.seed(10)
Data$Favorite.Color <- as.numeric
(Data$Favorite.Color)
Data$Favorite.Music.Genre <- as.numeric
(Data$Favorite.Music.Genre)
Data$Favorite.Beverage <- as.numeric
(Data$Favorite.Beverage)
Data$Favorite.Soft.Drink <- as.numeric
(Data$Favorite.Soft.Drink)
TrainingSize <- createDataPartition(Data$Gender,
p = 0.8,
list = FALSE)
TrainingData <- Data[TrainingSize,]
TestingData <- Data[-TrainingSize,]
|
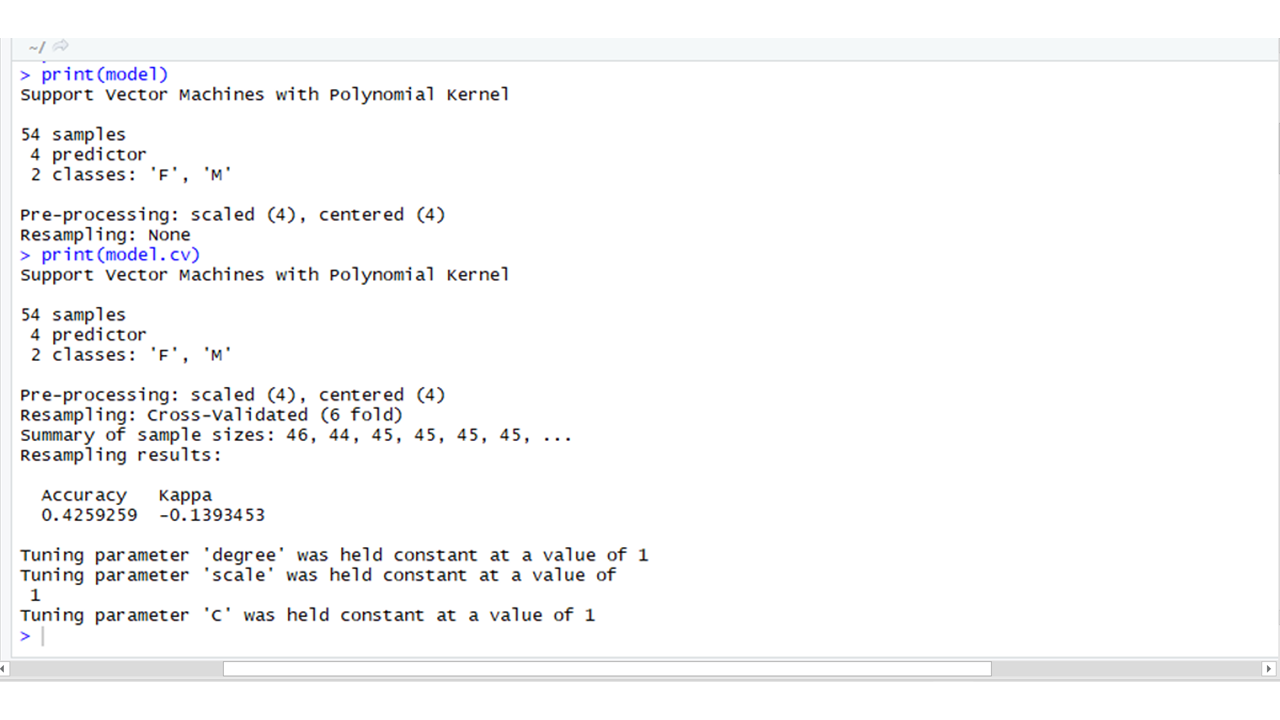
CARET: Caret stands for classification and regression training. The CARET package is used for performing classification and for regression tasks. It consists of many other built-in packages.
library(caret)
model <- train(Gender ~ ., data = TrainingData,
method = "svmPoly",
na.action = na.omit,
preProcess = c("scale", "center"),
trControl = trainControl(method = "none"),
tuneGrid = data.frame(degree = 1,
scale = 1,
C = 1)
)
model.cv <- train(Gender ~ ., data = TrainingData,
method = "svmPoly",
na.action = na.omit,
preProcess = c("scale", "center"),
trControl = trainControl(method = "cv",
number = 6),
tuneGrid = data.frame(degree = 1,
scale = 1,
C = 1)
)
print(model)
print(model.cv)
|
Output:
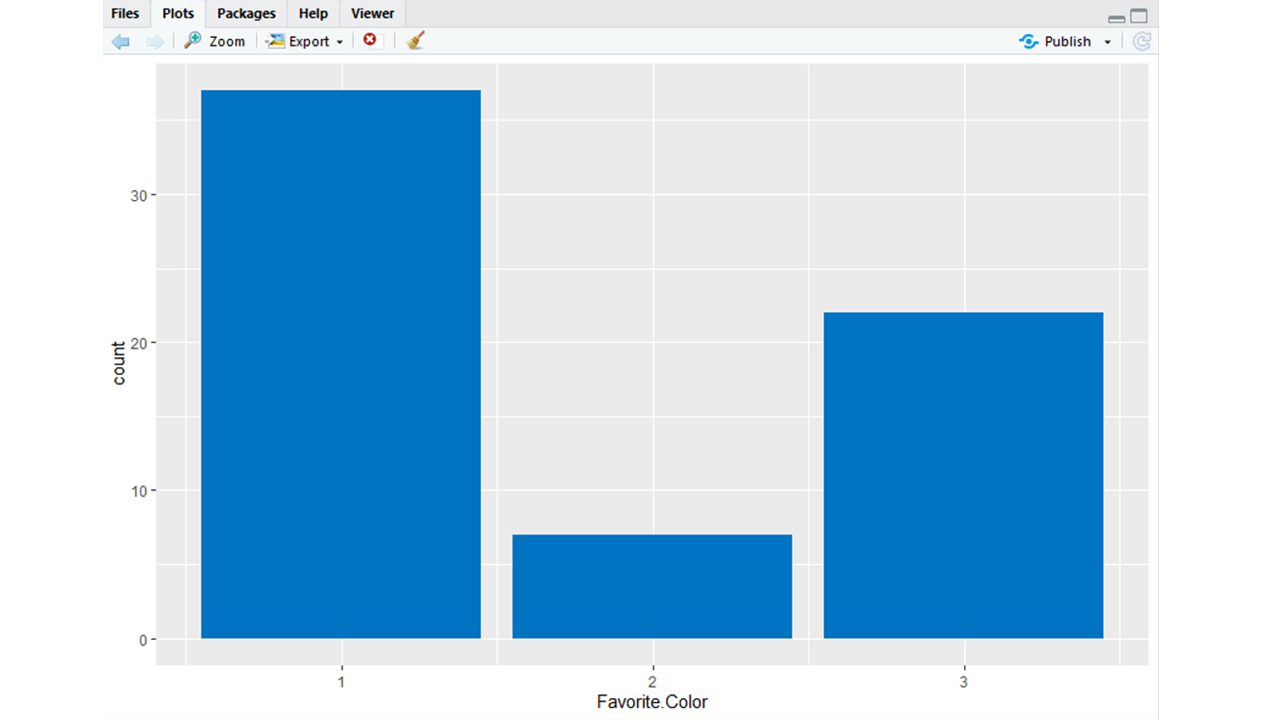
ggplot2: R is most famous for its visualization library ggplot2. It provides an aesthetic set of graphics that are also interactive. The ggplot2 package is used for creating plots and for visualising data.
ggplot(Data, aes(Favorite.Color)) +
geom_bar(fill = "#0073C2FF")
|
Output:
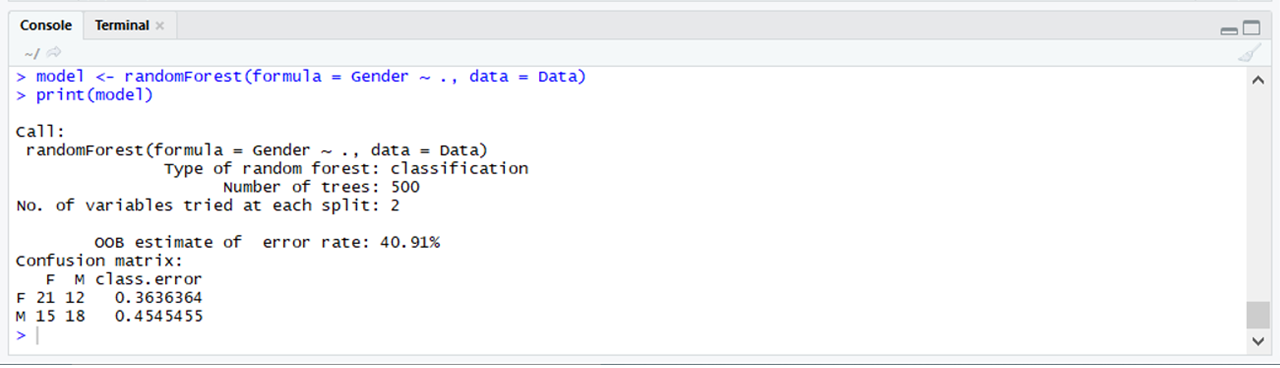
randomForest: The randomForest package allows us to use the random forest algorithm easily.
library(randomForest)
model <- randomForest(formula = Gender ~ .,
data = Data)
print(model)
|
Output:
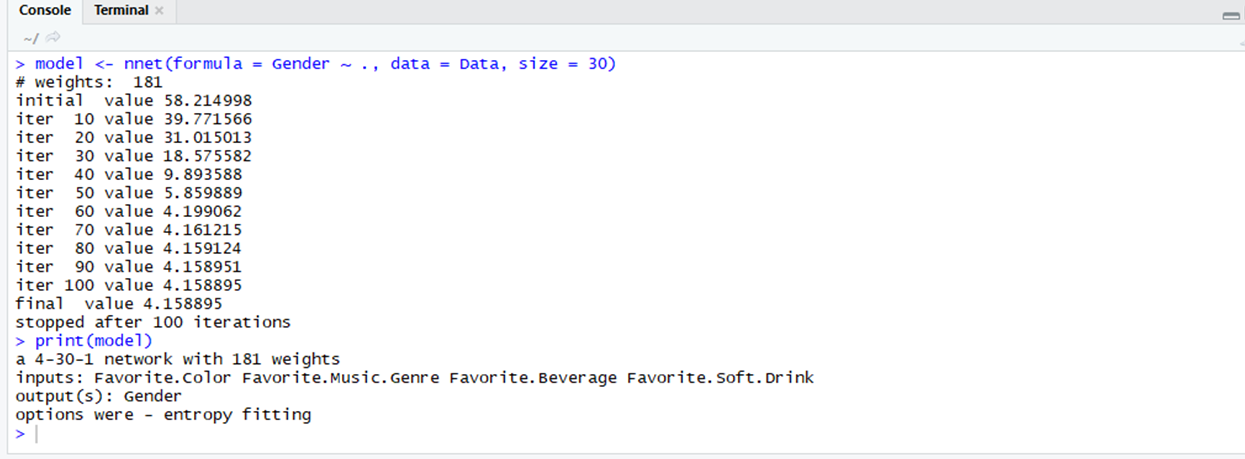
nnet: The nnet package uses neural networks in deep learning to create layers which help in training and predicting models. The loss (the difference between the actual value and predicted value) decreases after every iteration of training.
library(nnet)
model <- nnet(formula = Gender ~ .,
data = Data,
size = 30)
print(model)
|
Output:
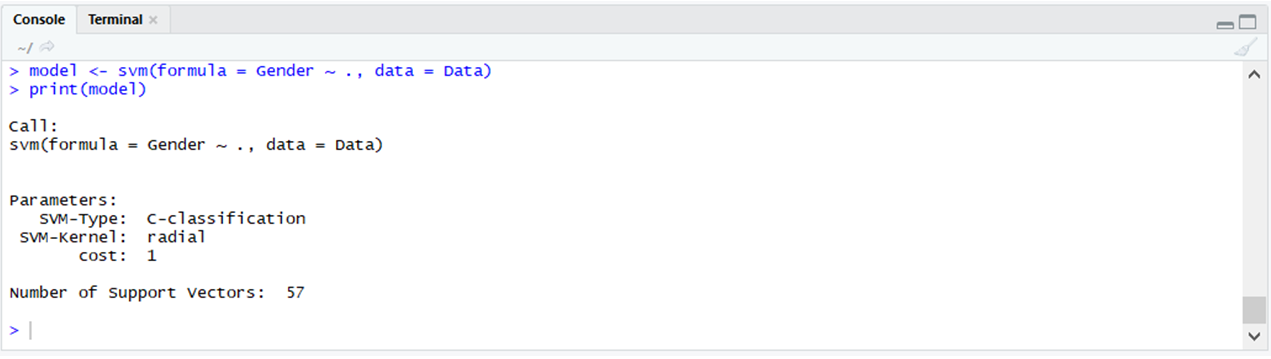
e1071: The e1071 package is used to implement the support vector machines, naive bayes algorithm and many other algorithms.
library(e1071)
model <- svm(formula = Gender ~ .,
data = Data)
print(model)
|
Output:
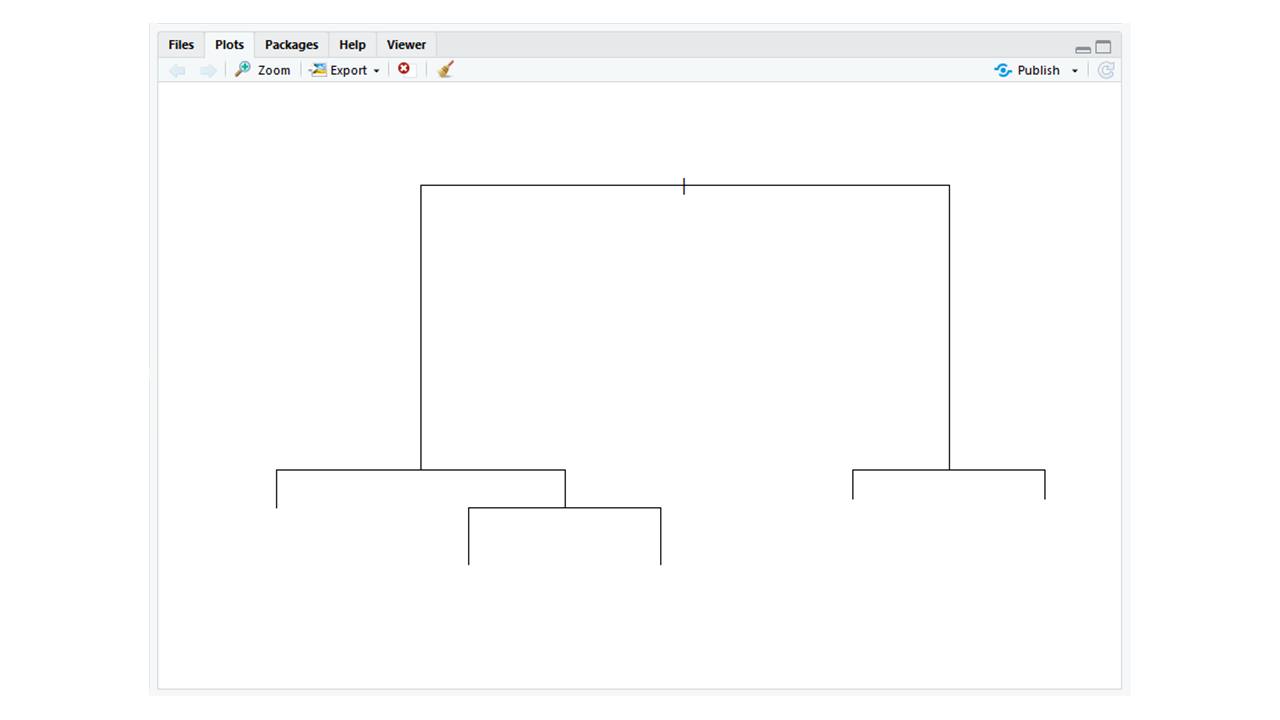
rpart: The rpart package is used to partition data. It is used for classification and regression tasks. The resultant model is in the form of a binary tree.
library(rpart)
partition <- rpart(formula = Gender~.,
data = Data)
plot(partition)
|
Output:
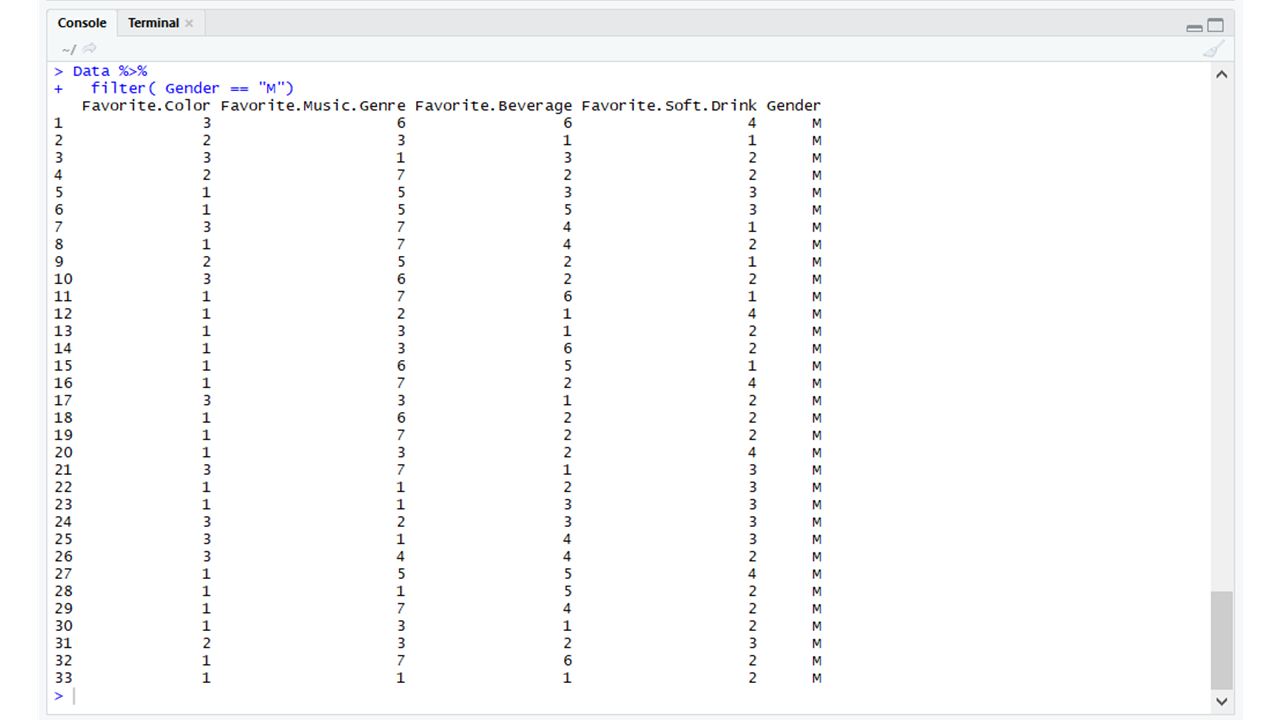
dplyr: Like rpart the dplyr package is also a data manipulation package. It helps manipulate data by using functions such as filter, select, and arrange.
library(dplyr)
Data %>%
filter(Gender == "M")
|
Output:
Like Article
Suggest improvement
Share your thoughts in the comments
Please Login to comment...