Set Origin of ggplot2 Plot Axes to Zero in R
Last Updated :
20 Feb, 2023
In this article, we will be looking at the approach to set the origin of the ggplot2 plot axes to zero with the help of some functions of R programming language.
In this approach to set the origin of the ggplot2 plot axes to zero, the user first needs to install and import the ggplot2 package in the working R console, and then call the scale_x_continuous() and scale_y_continuous() functions together with the plot, with the required parameters and this will add zeroes to the origin of both the ggplot2 plot axes in the R programming language,
Scale_x_continuous() and scale_y_continuous() functions functions are used to set the continuous position scales (x & y).
Syntax:
scale_x_continuous(…, expand = waiver())
scale_y_continuous(…, expand = waiver())
Parameters:
- …: common continuous scale parameters: name, breaks, labels, na.value, limits, and trans.
- Expand: a numeric vector of length two giving multiplicative and additive expansion constants.
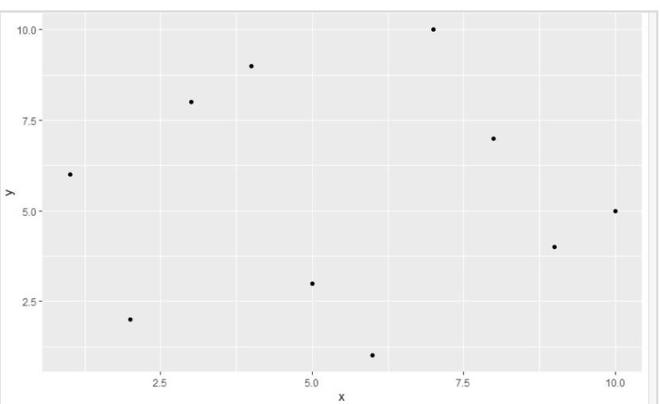
Let us first look at initial plot, so that the difference is apparent.
Example: initial plot
R
library(ggplot2)
gfg < - data.frame(x=c(4, 9, 5, 6, 10, 2, 3, 7, 8, 1),
y=c(9, 4, 3, 1, 5, 2, 8, 10, 7, 6))
gfg_plot < - ggplot(gfg, aes(x, y)) + geom_point()
gfg_plot
|
Output:
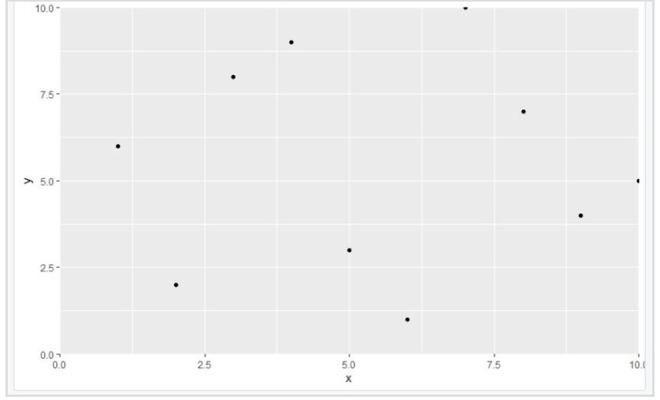
Now, let’s add zeroes to origin. using the approach described above.
Example: final plot
R
library(ggplot2)
gfg < - data.frame(x=c(4, 9, 5, 6, 10, 2, 3, 7, 8, 1),
y=c(9, 4, 3, 1, 5, 2, 8, 10, 7, 6))
gfg_plot < - ggplot(gfg, aes(x, y)) + geom_point()+
scale_x_continuous(expand=c(0, 0), limits=c(0, 10)) +
scale_y_continuous(expand=c(0, 0), limits=c(0, 10))
gfg_plot
|
Output:
Like Article
Suggest improvement
Share your thoughts in the comments
Please Login to comment...