Set Legend Alpha of ggplot2 Plot in R
Last Updated :
31 Aug, 2021
In this article, we are going to see how to set the legend alpha of the ggplot2 Plot in R Programming Language.
Setting the legend alpha of the plot using the alpha argument of the guide_legend function from the ggplot2 package.
Syntax: guide_legend(override.aes = list(alpha))
Parameters:
- override.aes: allows the user to change only the legend appearance without affecting the rest of the plot.
Note:
- The alpha value of the legend of the plot is used to set the transparency index of the legend symbol, In other words, the alpha value nearer to zero will make the legend transparent, and closer to value 1 will make the legend symbol opaque.
- Alpha values are any numbers from 0 (transparent) to 1 (opaque). The default alpha value usually is 1.
- The alpha can be set to a constant value or it can be mapped via a scale.
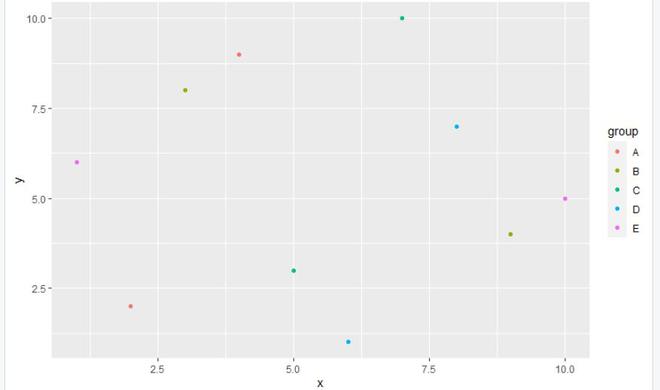
Without setting Legend alpha in ggplot2
In this example, we will be setting up the alpha value of the legend of the ggplot2 plot to a value using the alpha argument of the guide_legend function of the ggplot2 package in the R programming language.
R
library("ggplot2")
gfg<-data.frame(x =c(4,9,5,6,10,2,3,7,8,1),
y = c(9,4,3,1,5,2,8,10,7,6),
group = c('A','B','C','D','E'))
gfg_plot <- ggplot(gfg, aes(x, y, col = group)) + geom_point()
gfg_plot
|
Output:
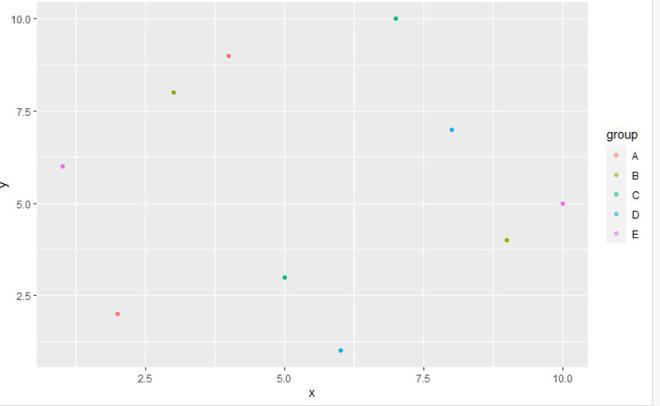
Using Alpha in ggplot2
Here we are going to set the legend alpha value.
Example 1: In this example, we will use the alpha value of 0.5 which will set the opaque of the legend.
R
library("ggplot2")
gfg<-data.frame(x =c(4,9,5,6,10,2,3,7,8,1),
y = c(9,4,3,1,5,2,8,10,7,6) ,
group = c('A','B','C','D','E'))
gfg_plot <- ggplot(gfg, aes(x, y, col = group)) + geom_point()
gfg_plot+guides(colour = guide_legend
(override.aes = list(alpha = 0.5)))
|
Output:
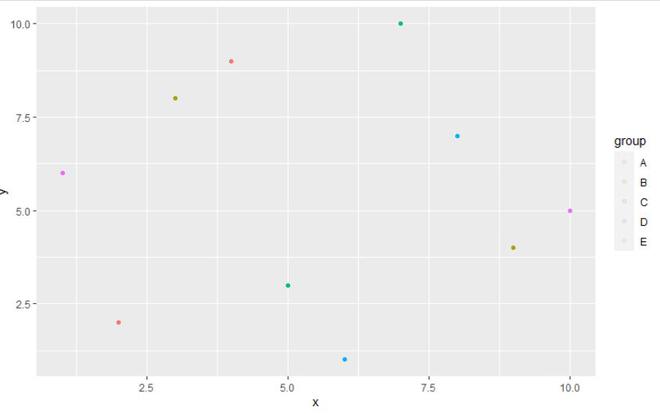
Example 2: In this example, we will be setting up the alpha value of the legend of the ggplot2 plot to a value equal to 0.1 using the alpha argument of the guide_legend function of the ggplot2 package in the R programming language.
R
library("ggplot2")
gfg<-data.frame(x = c(4,9,5,6,10,2,3,7,8,1),
y = c(9,4,3,1,5,2,8,10,7,6),
group = c('A','B','C','D','E'))
gfg_plot <- ggplot(gfg, aes(x, y, col = group)) + geom_point()
gfg_plot+guides(colour = guide_legend
(override.aes = list(alpha = 0.1)))
|
Output:
Like Article
Suggest improvement
Share your thoughts in the comments
Please Login to comment...