Semantic-UI Statistics Variations Inverted Variant
Last Updated :
12 Feb, 2022
Semantic UI is an open-source framework that offers a variety of components to make your UI more meaningful. One of them is “Statistics”.
Semantic UI has a Statistics component to magnify particular data for your website. Statistics values can be shown in different colors as per requirement. Users can also display the statistics in a dark background. Let us see this variation of statistics.
If you want to display statistics on black background users can use inverted statistics. A single or group of statistics showing relatable content can be displayed in dark background. We will create a UI to show the statistics inverted variation.
Semantic-UI Statistics Inverted Variation Class:
- inverted: This class is used to make the statistics inverted(color-wise).
Syntax:
<div class="ui inverted segment">
    <div class="ui inverted statistic">
     .....
    </div>
</div>
Example 1: This example demonstrates statistics inverted variation by using inverted class.
HTML
<!DOCTYPE html>
<html>
<head>
<link href=
rel="stylesheet" />
</head>
<body>
<div class="ui container">
<h2 class="ui header green">GeeksforGeeks</h2>
<b>
Semantic-UI Statistics Variations Inverted Variant
</b>
<div class="ui inverted segment">
<div class="ui inverted statistic">
<div class="value">
1
</div>
<div class="label">
Label 1
</div>
</div>
<div class="ui green inverted statistic">
<div class="value">
2
</div>
<div class="label">
Label 2
</div>
</div>
<div class="ui inverted statistic">
<div class="value">
3
</div>
<div class="label">
Label 3
</div>
</div>
</div>
</div>
</body>
</html>
|
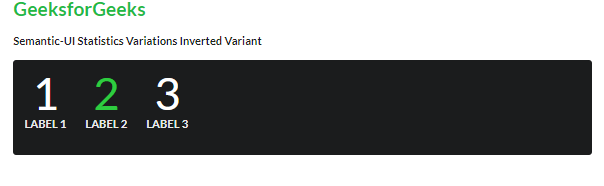
Output: You can see in the first row all the statistics in the dark background. All the values of the statistics are in the dark background since the statistics are tagged with inverted class. It can be easily interpreted through the code that dark background statistics with white color are visible as shown in the figure by adding the inverted class.
Semantic-UI Statistics Variations Inverted Variant
Reference: https://semantic-ui.com/views/statistic.html#inverted
Like Article
Suggest improvement
Share your thoughts in the comments
Please Login to comment...