scipy stats.skewtest() function | Python
Last Updated :
11 Feb, 2019
scipy.stats.skewtest(array, axis=0) function test whether the skew is different from the normal distribution. This function tests the null hypothesis that the skewness of the population that the sample was drawn from is the same as that of a corresponding normal distribution.
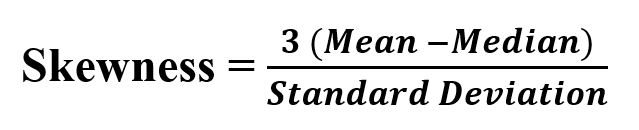
Its formula –
Parameters :
array : Input array or object having the elements.
axis : Axis along which the skewness test is to be computed. By default axis = 0.
Returns : Z-score (Statistics value) and P-value for the hypothesis test on data set.
Code #1:
from scipy.stats import skewtest
import numpy as np
import pylab as p
x1 = np.linspace( -5, 5, 1000 )
y1 = 1./(np.sqrt(2.*np.pi)) * np.exp( -.5*(x1)**2 )
p.plot(x1, y1, '*')
print( '\nSkewness test for given data :\n', skewtest(y1))
|
Output :
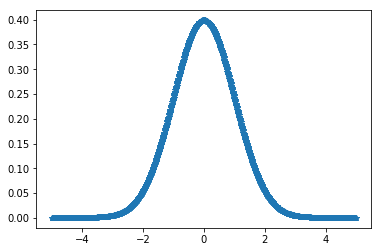 Skewness test for given data :
SkewtestResult(statistic=11.874007880556805, pvalue=1.6153913086650964e-32)
Skewness test for given data :
 SkewtestResult(statistic=11.874007880556805, pvalue=1.6153913086650964e-32)
Code #2:
from scipy.stats import skewtest
import numpy as np
import pylab as p
x1 = np.linspace( -5, 12, 1000 )
y1 = 1./(np.sqrt(2.*np.pi)) * np.exp( -.5*(x1)**2 )
p.plot(x1, y1, '.')
print( '\nSkewness for data :\n', skewtest(y1))
|
Output :
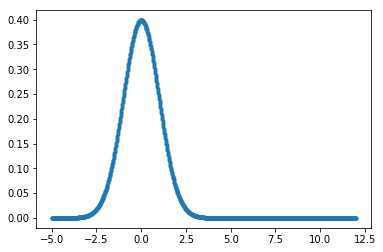 Skewness for data :
SkewtestResult(statistic=16.957642860709516, pvalue=1.689888374767126e-64)
Skewness for data :
 SkewtestResult(statistic=16.957642860709516, pvalue=1.689888374767126e-64)
Like Article
Suggest improvement
Share your thoughts in the comments
Please Login to comment...