SciPy – Cluster Hierarchy Dendrogram
Last Updated :
21 Nov, 2021
In this article, we will learn about Cluster Hierarchy Dendrogram using Scipy module in python. For this first we will discuss some related concepts which are as follows:
Hierarchical Clustering
Hierarchical clustering requires creating clusters that have a predetermined ordering from top to bottom. It is a type of unsupervised machine learning algorithm used to cluster unlabeled data points.
How to Perform?
- Each data point should be treated as a cluster at the start.
- Denote the number of clusters at the start as K.
- Form one cluster by combining the two nearest data points resulting in K-1 clusters.
- Form more clusters by combining the two closest clusters resulting in K-2 clusters.
- Repeat the above four steps until a single big cluster is created.
- Dendrograms are used to divide into multiple clusters as soon as a cluster is created.
Types of hierarchical Clustering
1. Divisive clustering
Divisive clustering, also known as the top-down clustering method assigns all of the observations to a single cluster and then partition the cluster into two least similar clusters.
2. Agglomerative clustering
In the agglomerative or bottom-up clustering method, each observation is assigned to its own cluster.
Algorithms
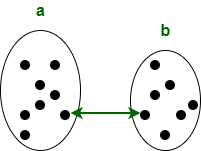
1. Single Linkage
Single linkage clustering often yields clusters in which individuals are added sequentially to a single group. The distance between the two clusters is defined as the distance between their two nearest data points.
L(a , b) = min(D(xai , xbj))
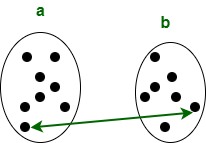
2. Complete Linkage
Complete linkage clustering generally yields clusters that are well segregated and compact. The distance between the two clusters is defined as the longest distance between two data points in each cluster.
L(a , b) = max(D(xai , xbj))
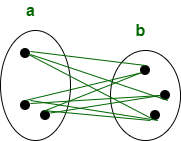
3. Simple Average
The simple average algorithm defines the distance between clusters as the average distance between each of the members, weighted so that the two clusters have an equal influence on the final output.
L(a , b) = Tab / ( Na * Nb)
Tab: The sum of all pairwise distances between the two clusters.
Na and Nb: The sizes of the clusters a and b, respectively.
Dendrogram
A Dendrogram is a tree-like diagram used to visualize the relationship among clusters. More the distance of the vertical lines in the dendrogram, the more the distance between those clusters. The key to interpreting a dendrogram is to concentrate on the height at which any two objects are joined together.
Example of a dendrogram:
Suppose we have six clusters: P, Q, R, S, T, and U. Cluster Hierarchy Dendrogram of these six observations shown on the scatterplot is:
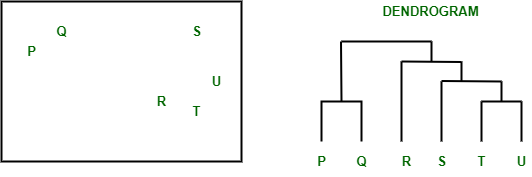
Dendrogram from the given scatterplot
Parts of a dendrogram:
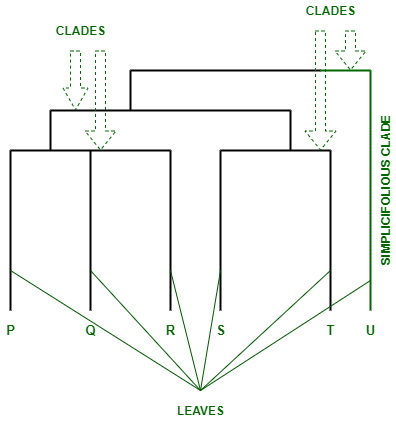
Parts of a Dendrogram
- The branches of the dendrogram are called the Clades. These clades are arranged according to how similar or dissimilar they are.
- Each clade of the dendrogram has one or more leaves. P, Q, R, S, T, and U are leaves of the dendrogram:
- Triple (trifolious): P, Q, R
- Double (bifolius): S, T
- Single (simplicifolius): U
Implementing hierarchical clustering and plotting dendrogram
For implementing the hierarchical clustering and plotting dendrogram we will use some methods which are as follows:
- The functions for hierarchical and agglomerative clustering are provided by the hierarchy module.
- To perform hierarchical clustering, scipy.cluster.hierarchy.linkage function is used. The parameters of this function are:
Syntax: scipy.cluster.hierarchy.linkage(ndarray , method , metric , optimal_ordering)
- To plot the hierarchical clustering as a dendrogram scipy.cluster.hierarchy.dendrogram function is used.
Syntax: scipy.cluster.hierarchy.dendrogram(Z , p , truncate_mode , color_threshold , get_leaves , orientation , labels , count_sort , distance_sort , show_leaf_counts , no_plot , no_labels , leaf_font_size , leaf_rotation , leaf_label_func , show_contracted , link_color_func , ax , above_threshold_color)
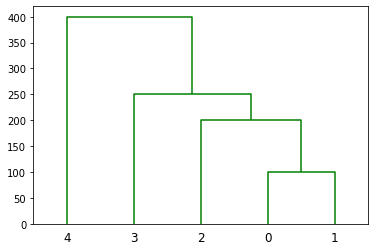
Example 1: Normal Dendrogram
Python
import numpy as np
from scipy.cluster import hierarchy
import matplotlib.pyplot as plt
x = np.array([100., 200., 300., 400., 500., 250.,
450., 280., 450., 750.])
temp = hierarchy.linkage(x, 'single')
plt.figure()
dn = hierarchy.dendrogram(
temp, above_threshold_color="green", color_threshold=.7)
|
Output:
Example 2: Dendrogram using horizontal orientation:
Python
import numpy as np
from scipy.cluster import hierarchy
import matplotlib.pyplot as plt
x = np.array([100., 200., 300., 400., 500., 250.,
450., 280., 450., 750.])
temp = hierarchy.linkage(x, 'single')
plt.figure()
dn = hierarchy.dendrogram(
temp, above_threshold_color="green", color_threshold=.7, orientation='right')
|
Output:
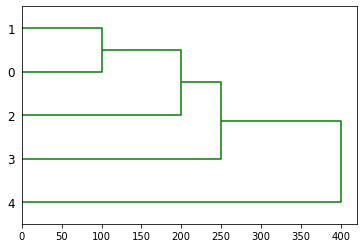
The parameter orientation of scipy.cluster.hierarchy.dendrogram has been set to ‘right’. It plots the root at the right, and plot descendant links going left.
Like Article
Suggest improvement
Share your thoughts in the comments
Please Login to comment...