Saving a Networkx graph in GEXF format and visualize using Gephi
Last Updated :
29 Sep, 2021
Prerequisites: Networkx
NetworkX is a Python language software package for the creation, manipulation, and study of the structure, dynamics, and function of complex networks. It is used to study large complex networks represented in form of graphs with nodes and edges. Using networkx we can load and store complex networks. We can generate many types of random and classic networks, analyze network structure, build network models, design new network algorithms and draw networks.
In this article we will discuss how we can save a networkx graph in GEXF format and then visualize it using Gephi.
GEXF stands for Graph Exchange XML Format. Although it has features for supporting visualization of graphs but there are some limitations of visualization methods provided by NetworkX library. Hence, the need of using external tools like Gephi used for graph visualization arises. But we cannot straight away export graphs from python to Gephi we need to convert the graph into a format supported by it. GEXF is one such file format.
Gephi needs to installed first to be used: Gephi
Saving the NetworkX graph in gexf format
To achieve this we will be employing write_gexf() function which as the name suggests saves a networkx graph into gexf format easily.
Syntax:
networkx.write_gexf( G , path )
Parameter:
- G: In this argument NetworkX graph object or simply the graph is sent as parameter.
- path: In this argument a valid path for saving the graph is specified.
Approach:
- Import module
- Create a networkx graph
- Save this graph in gexf format
Program:
Python3
import networkx as nx
G = nx.path_graph(10)
nx.write_gexf(G, "geeksforgeeks.gexf")
|
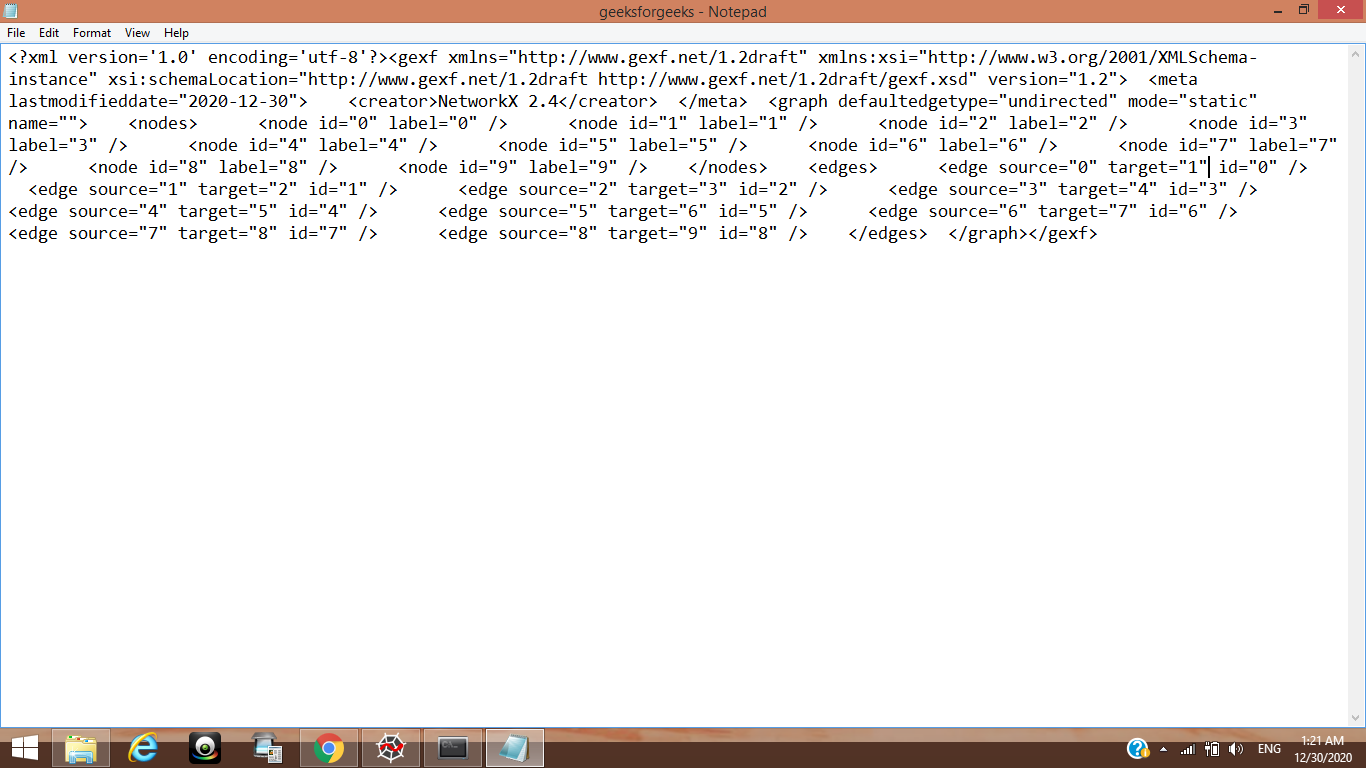
Output:
A file named geeksforgeeks.gexf will be saved at the specified path, it can be viewed using any text editor which will be shown in XML.
Visualizing using Gephi
The graph created in the above program will be visualized using Gephi.
Approach
- Install Gephi
- Import gexf file
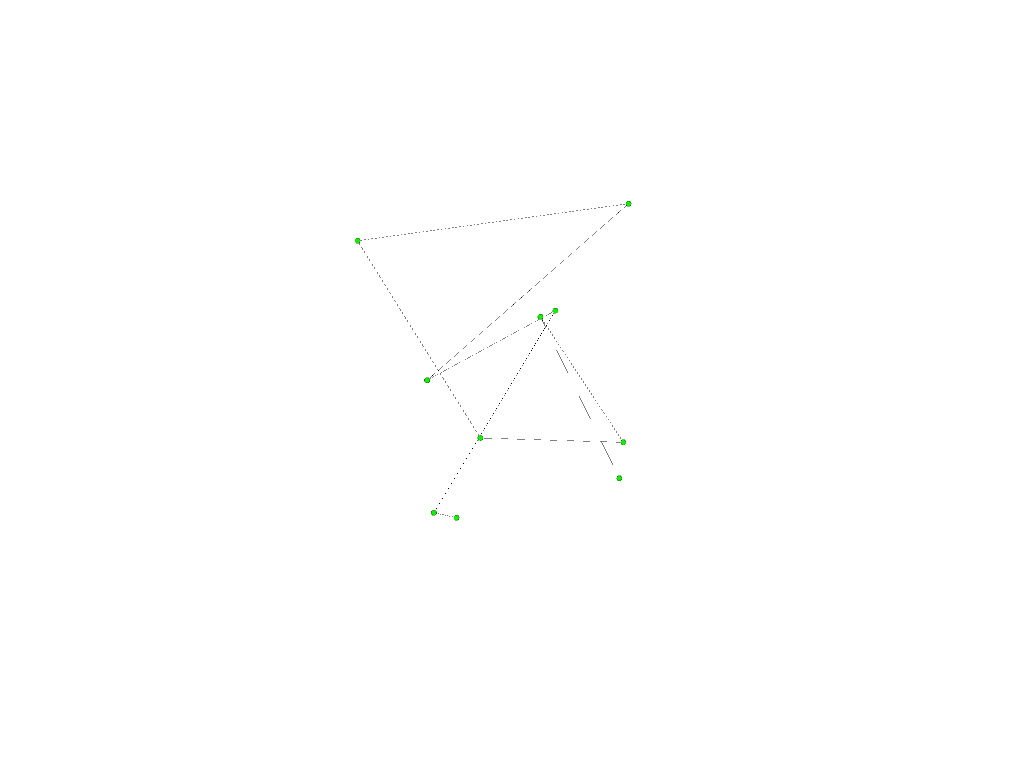
After visualization this is what the graph looks like:
Like Article
Suggest improvement
Share your thoughts in the comments
Please Login to comment...