SAR command in Linux to monitor system performance
Last Updated :
31 Jul, 2023
sar (System Activity Report) It can be used to monitor Linux system’s resources like CPU usage, Memory utilization, I/O devices consumption, Network monitoring, Disk usage, process and thread allocation, battery performance, Plug and play devices, Processor performance, file system and more. Linux system Monitoring and analyzing aids in understanding system resource usage which can help to improve system performance to handle more requests.
By default, the SAR command displays the result on the output screen, in addition, result can also be stored in the file specified by the -o filename option.
Any user can collect information about system performance using system activity flags. The SAR command will show only CPU monitoring activity if any flag is not specified by the user.
Installation of `sar` in Linux
`sar` may not be installed by default. We need to install `sysstat` before using it
To install `sar` in Ubuntu
sudo apt install sysstat
To install `sar` in RedHat Linux (9)
Sudo dnf install sysstat
Syntax of `sar` command in Linux
sar -[ options ] time_interval number_of_tines_to_display
Examples and Options
To start `sar` Service
Syntax:
systemctl start sysstat.service

Starting sar service
`–help` option in `sar` command
Syntax:
sar --help

sar –help
We need to enter the root password for authentication.
To verify the `sar` version
Syntax:
sar -V

version of sar
CPU Usage Details
To report CPU details a total of 5 times with the interval of 2 seconds. If the interval command is set to zero, average statistics from the time system started are presented. If the count is not provided and the interval is given, statistics are provided continuously after every interval.
Syntax:
sar -u 2 5

CPU Usage Details
Memory Usage Details
To report about the amount of memory used, amount of memory free, available cache, available buffers total 3 times with the interval of 1 second.
Syntax:
sar -r 1 3
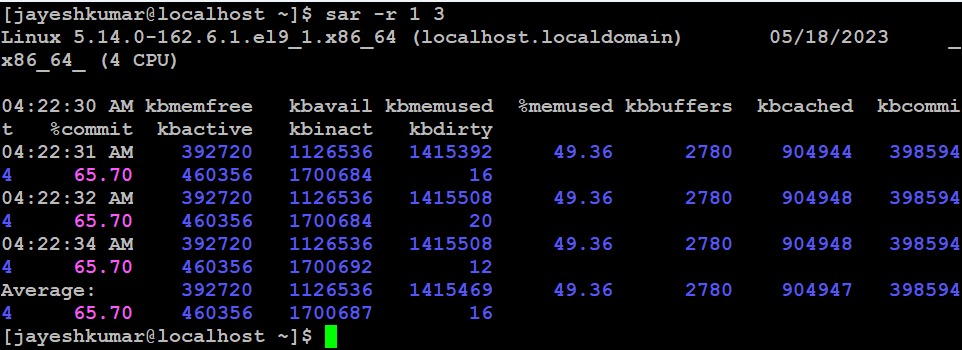
Memory Usage
To report about file systems mounted on the device total 5 times with the interval of 2 seconds.
Syntax:
sar -F 2 5
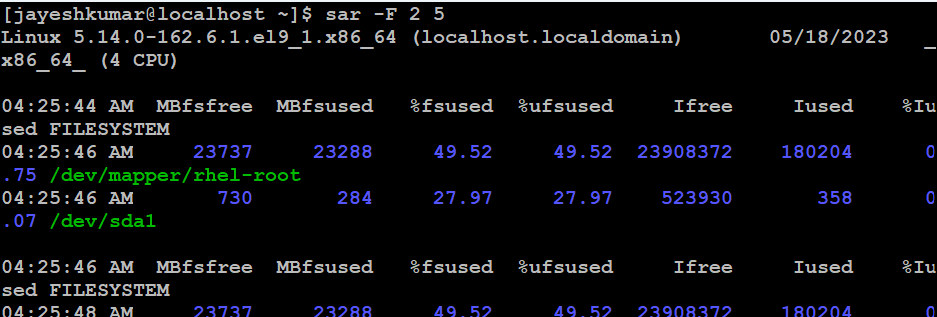
File system
To report about block devices details total 3 times with the interval of 1 second.
Syntax:

Blocked Device
Run Queue Length and Load Average
To report run queue length, number of processes and load average
Syntax:
sar -q 2 5

Run Queue Length and average
CPU Usage for a Specific Core
To report cpu usage for given core
sar -P 1 1 3

CUP usage for a specific core
Network Interface Details
To report about network interface, network speed, IPV4, TCPV4, ICMPV4 network traffic and errors
Syntax:
sar -n DEV 1 3 | egrep -v lo

Network Interface
Process, Kernel Thread, I-node, and File Table Details
To report details about the process, kernel thread, i-node, and the file tables
Syntax:
sar -v 1 3

Messages, Semaphores, and Process Details
To report messages, semaphores and processes details for all processors and system-wide.
sar -mu -P ALL
Swapping Statistics
To report statistics about swapping
Syntax:
sar -S 1 3

Swapping Statistics
I/O Operation Details
To report details about I/O operations like transaction per second, read per second, write per second.
syntax:
sar -b 1 3

I/O Operations Details
Context Switching, Process Creation, and Swap Details
To report statistics about context switching, number of processes created per second, number of swap per second .
sar -w 1 3

Paging Statistics
To report paging statistics (KBs paged-in/sec, KBs paged-out/sec, pagefault/sec etc.)
sar -B 2 5
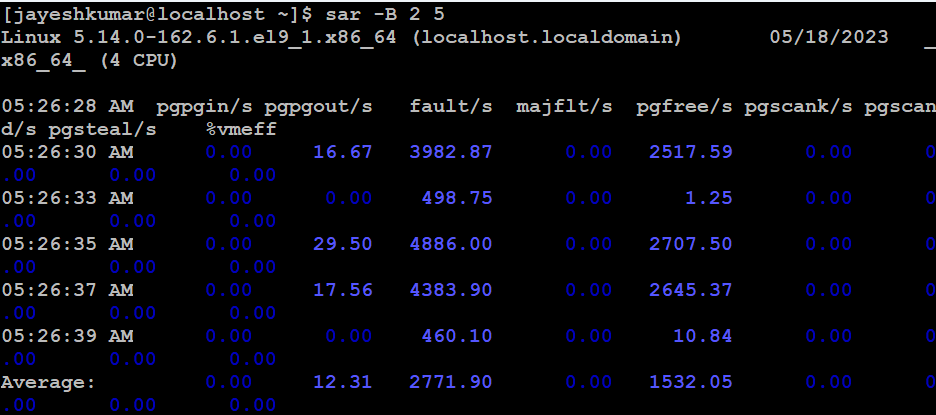
Paging Statics
In this article we discussed The SAR (System Activity Report) command in Linux is a powerful tool for monitoring and analyzing system resources. It provides detailed information on CPU usage, memory utilization, I/O devices, network monitoring, disk usage, and more. SAR helps system administrators and developers understand system performance, identify bottlenecks, and optimize resource allocation for improved efficiency and stability. It is an essential tool for managing and optimizing Linux systems.
Like Article
Suggest improvement
Share your thoughts in the comments
Please Login to comment...