Reorder Facets in ggplot2 Plot in R
Last Updated :
31 Aug, 2021
In this article, we will be looking at an approach to reorder the facets in the ggplot2 plot in R programming language.
To reorder the facets accordingly of the given ggplot2 plot, the user needs to reorder the levels of our grouping variable accordingly with the help of the levels function and required parameter passed into it, further it will lead to the reordering of the facets accordingly in the R programming language.
Level function provides access to the levels attribute of a variable. The first form returns the value of the levels of its argument and the second sets the attribute.
Syntax:
levels(x)
Parameters:
- x: an object, for example, a factor.
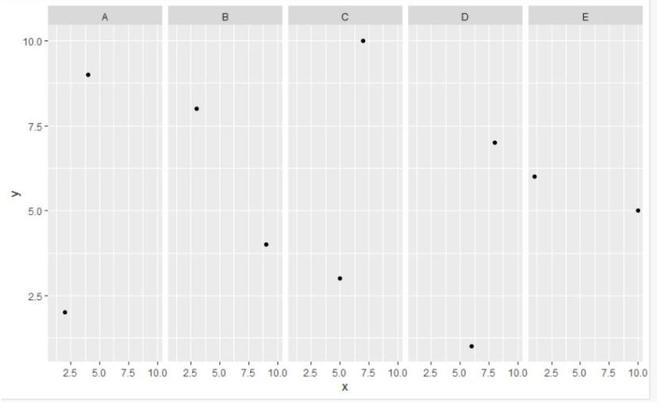
Let us first look at the initial plot. so that the difference after reordering can be observed prominently.
Example: initial plot
R
library(ggplot2)
gfg < - data.frame(x=c(4, 9, 5, 6, 10, 2, 3, 7, 8, 1),
y=c(9, 4, 3, 1, 5, 2, 8, 10, 7, 6),
group=c('A', 'B', 'C', 'D', 'E'))
gfg_plot < - ggplot(gfg, aes(x, y)) +
geom_point() + facet_grid(.~group)
gfg_plot
|
Output:
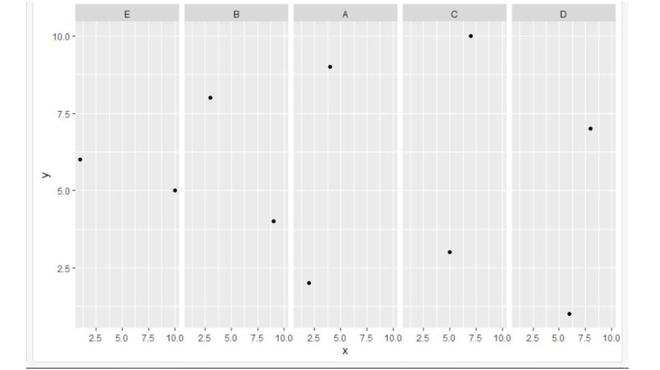
Now let’s reorder facets using the levels function.
Example: Plot after reordering of facets
R
library(ggplot2)
gfg < - data.frame(x=c(4, 9, 5, 6, 10, 2, 3, 7, 8, 1),
y=c(9, 4, 3, 1, 5, 2, 8, 10, 7, 6),
group=c('A', 'B', 'C', 'D', 'E'))
gfg$group < - factor(gfg$group, levels=c("E", "B", "A", "C", "D"))
gfg_plot < - ggplot(gfg, aes(x, y)) + geom_point() +
facet_grid(.~group)
gfg_plot
|
Output:
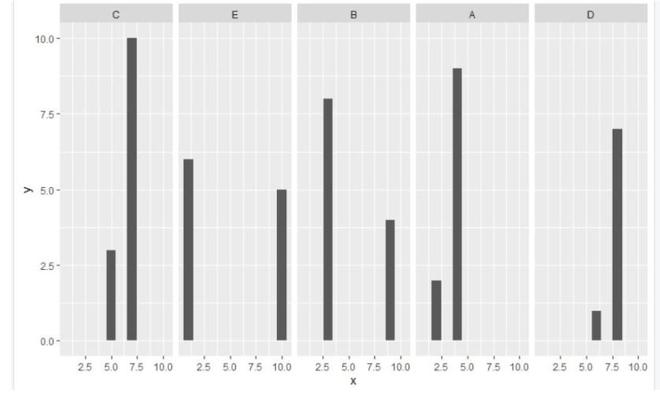
Example: In this example, we will be using a set of 10 data points for the ggplot2 bar plot and will be reordering the facets of this bar plot accordingly with the help of the level function.
R
library(ggplot2)
gfg < - data.frame(x=c(4, 9, 5, 6, 10, 2, 3, 7, 8, 1),
y=c(9, 4, 3, 1, 5, 2, 8, 10, 7, 6),
group=c('A', 'B', 'C', 'D', 'E'))
gfg$group < - factor(gfg$group, levels=c("C", "E", "B", "A", "D"))
gfg_plot < - ggplot(gfg, aes(x, y)) + geom_bar(stat="identity") +
facet_grid(.~group)
gfg_plot
|
Output:
Like Article
Suggest improvement
Share your thoughts in the comments
Please Login to comment...