Remove NA Values from ggplot2 Plot in R
Last Updated :
23 Aug, 2021
In this article, we are going to see how to remove the NA values from the ggplot2 plot in the R programming language.
Using complete.cases() function
complete.cases() function: This function will be returning a logical vector indicating which cases are complete, i.e., have no missing values.
Syntax: complete.cases(…)
Arguments:
- …: a sequence of vectors, matrices, and data frames.
Create dataframe with NA values for demonstration:
Python3
library("ggplot2")
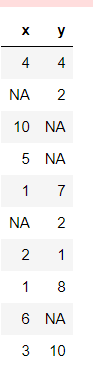
data <- data.frame(x = c(4,NA, 10,5, 1, NA, 2, 1, 6, 3),
y = c(4, 2, NA, NA, 7, 2, 1, 8,NA,10))
data
|
Output:
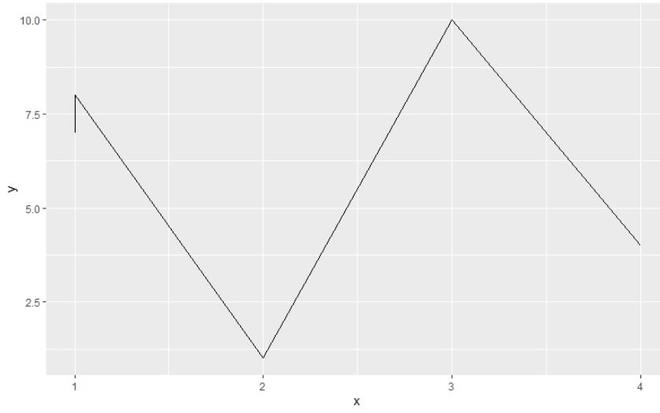
Example 1: Removing NA values from plot
In this example, we will be plotting a ggplot2 line plot of 10 data points and further with the help of the complete.cases() function we will be removing the NA value to plot the ggplot2 line plot in the R programming language.
R
library("ggplot2")
data <- data.frame(x = c(4,NA, 10,5, 1, NA, 2, 1, 6, 3),
y = c(4, 2, NA, NA, 7, 2, 1, 8,NA,10))
data_complete=data[complete.cases(data), ]
ggplot(data_complete, aes(x, y)) +geom_line()
|
Output:
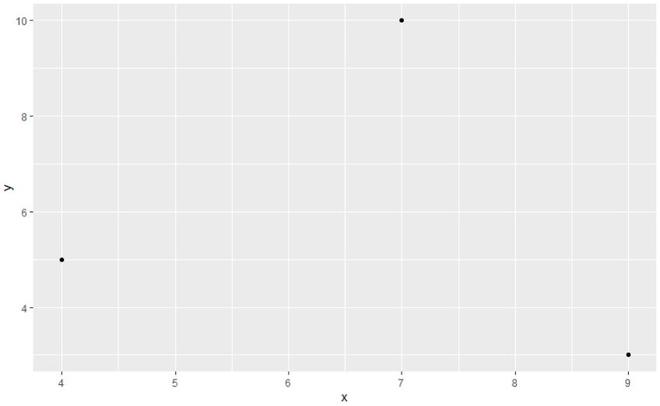
Example 2: Removing NA values from plot with a different dataset
In this example, we will be plotting a ggplot2 plot of 5data points and further with the help of the complete.cases() function we will be removing the NA value to plot the ggplot2 plot in the R programming language.
R
library("ggplot2")
data <- data.frame(x =c(7,9,NA,4,NA),
y=c(10,3,8,5,6) )
data_complete = data[complete.cases(data), ]
ggplot(data_complete, aes(x, y)) +geom_point()
|
Output:
Like Article
Suggest improvement
Share your thoughts in the comments
Please Login to comment...