Remove grid and background from plot using ggplot2 in R
Last Updated :
15 Feb, 2023
Prerequisite: ggplot2 in R programming
A plot by default is produced with a grid background and grayish colored background. This article discusses how they can be removed. The examples given below use line plot, but the same can be employed for any other Visualization.
Approach
- Create data frame
- Plot normally
- Now add functions to make changes
- Display plot
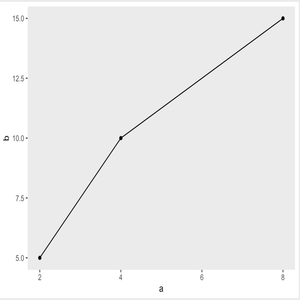
To understand the difference better let us first create a plot with grid and background.
Program:
R
df <- data.frame(a=c(2,4,8), b=c(5, 10, 15))
plot = ggplot(df, aes(x = a, y = b)) + geom_point() + geom_line()
plot
|
Output:

Basic Line Plot
Now, We are going to perform some operation/ modification on this plot.
Remove Grid:
Assigning the grid’s major and minor with the element_blanck() function, will remove the grid but not remove the background color and borderlines.
Program:
R
df <- data.frame(a=c(2,4,8),b=c(5, 10, 15))
plot + theme(panel.grid.major = element_blank(),
panel.grid.minor = element_blank())
|
Output:
Remove Grid But not remove Background
Only Grid and Axis Line:
Using theme_bw() function with the plot removes the grayish background but doesn’t affect the Grid.
Program:
R
df <- data.frame(a=c(2,4,8),b=c(5, 10, 15))
plot + theme_bw()
|
Output:
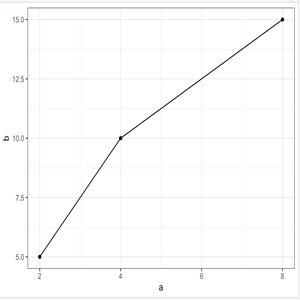
Only Grid and Axis
Remove Background and Grid:
Assigning panel.background with element_blank() function will remove both grid and the background.
Program:
R
df <- data.frame(a=c(2,4,8),b=c(5, 10, 15))
plot + theme(panel.background = element_blank())
|
Output:
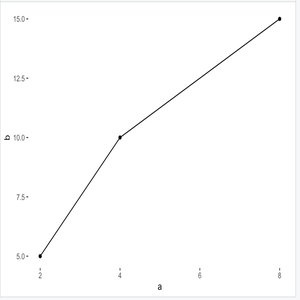
Remove Grid and Background
Like Article
Suggest improvement
Share your thoughts in the comments
Please Login to comment...