Remove Axis Values of Plot in Base R
Last Updated :
14 Sep, 2021
In this article, we will be looking at the approach to remove axis values of the plot using the base functions of the R programming language.
In this approach to remove the axis values of the plot, the user just need to use the base function plot() of the R programming language, and further in this function the user needs to use the axt argument of this function and set its value to “n” and this will be leading to the removal of the Axis Values of Plot in R programming language.
Note:
- xaxt: It is used for the x-axis
- yaxt: It is used for the y-axis
Plot() function is a generic function for plotting of R objects.
Syntax: plot(x, y,xaxt/yaxt, …)
Parameters:
- x: the x coordinates of points in the plot.
- y: the y coordinates of points in the plot
- xaxt/yaxt: suppress the x and y-axis respectively
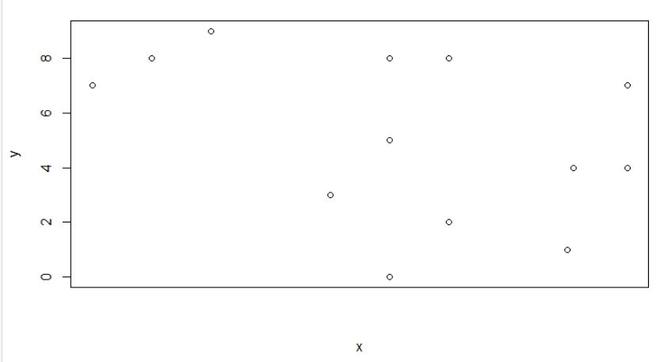
Example: In this example, we will be creating a simple scatter plot and with the use of the xaxt argument of the plot function we will be removing the x-axis value of the plot
R
x = c(1, 2, 5, 6, 9, 6, 5, 4, 8.1, 8, 9, 0, 5)
y = c(8, 9, 8, 8, 7, 2, 0, 3, 4, 1, 4, 7, 5)
plot(x, y, xaxt="n")
|
Output:
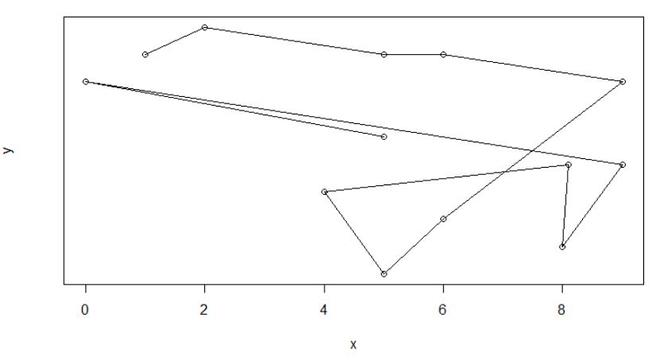
Example: In this example, we will be creating a line plot and with the use of the yaxt argument of the plot function we will be removing the y-axis value of the plot
R
x = c(1, 2, 5, 6, 9, 6, 5, 4, 8.1, 8, 9, 0, 5)
y = c(8, 9, 8, 8, 7, 2, 0, 3, 4, 1, 4, 7, 5)
plot(x, y, yaxt="n", type="o")
|
Output:
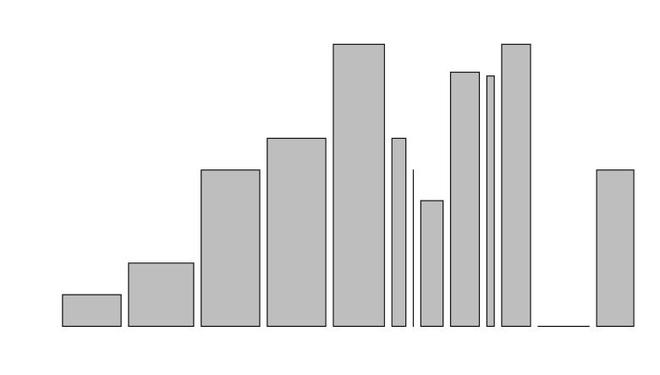
Example: In this example, we will be creating a bar plot and with the use of the xaxt and yaxt argument of the plot function we will be removing the x-axis and y-axis values of the plot
R
x = c(1, 2, 5, 6, 9, 6, 5, 4, 8.1, 8, 9, 0, 5)
barplot(x, y, yaxt="n", xaxt="n")
|
Output:
Like Article
Suggest improvement
Share your thoughts in the comments
Please Login to comment...