Reference Band in Tableau
Last Updated :
01 Oct, 2020
In this article, we will learn how to draw a reference band in tableau worksheet to do further operations. For this first look into two terms:
- Tableau: Tableau could also be a really powerful data visualization tool that can be used by data analysts, scientists, statisticians, etc. to ascertain the data and acquire a transparent opinion supported the data analysis. Tableau is extremely famous because it can absorb data and produce the required data visualization output during a really short time.
- Reference Band: A reference band is a shaded region behind a graph of a continuous measure, and it is useful for highlighting the area falling in that band. A reference band shades the area from and to a certain range, making it easier to identify and understand the values falling into the band.
Dataset used in the given examples is Dataset.
For this we have to follow some steps :
Open the Tableau tool and connect a dataset into it. Drag and drop the one sheet of the connected dataset. Click on sheet1 to open the tableau worksheet. On clicking Sheet1 you will get whole dataset attributes on the left side and a worksheet for work.
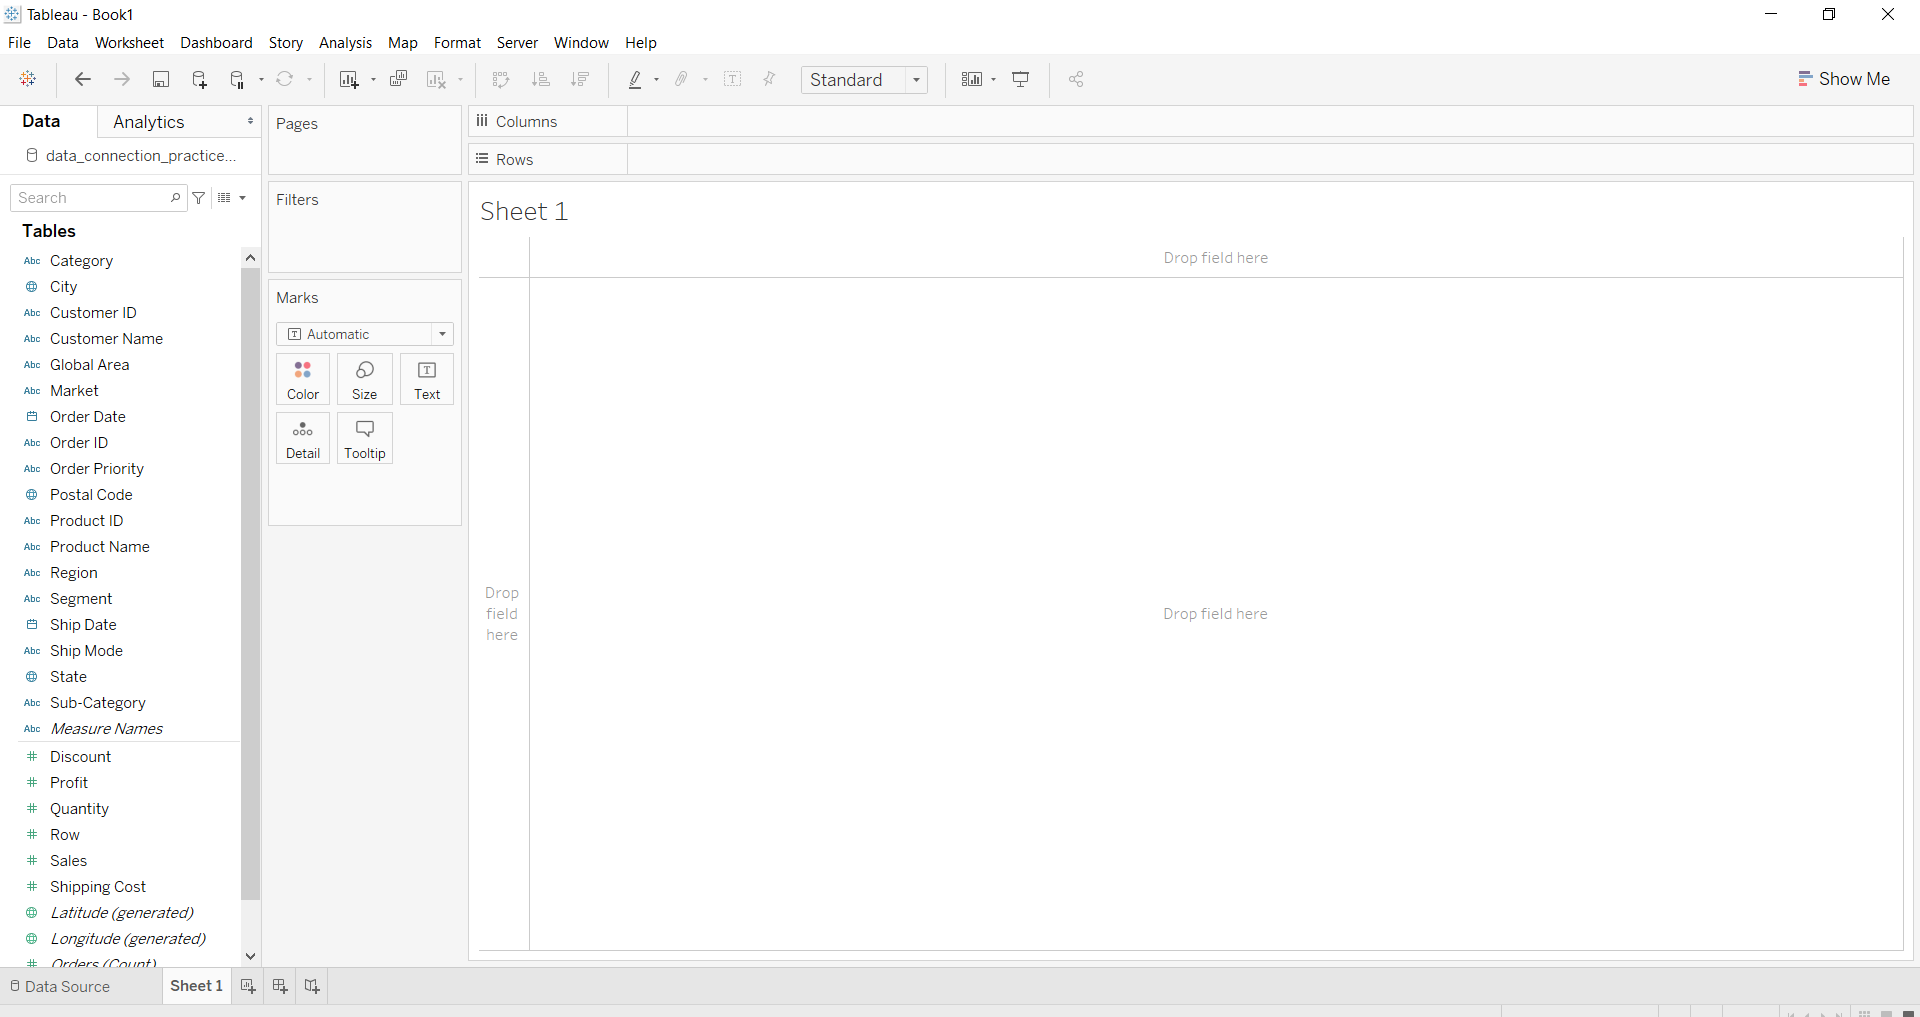
To draw a reference band you have to first draw a graph or chart by selecting attributes( by drag and drop ) then apply the concept of reference band.
Draw a Reference Band
Edit a Reference Band
Format a Reference Band
Remove a Reference Band
Like Article
Suggest improvement
Share your thoughts in the comments
Please Login to comment...