Reduce Space Around Plot in R
Last Updated :
23 Sep, 2021
In this article, we will discuss how to reduce space around the plot using the base functions of the R programming language.
To reduce the space around the plot, the user needs to just simply call the par function which is an inbuilt- function of the R programming language, and then pass the specific parameters into this function as per required by the user, further this process will be leading to the result in which reducing space around the plot takes place.
Par() function can be used to set or query graphical parameters. Parameters can be set by specifying them as arguments to par in tag = value form, or by bypassing them as a list of tagged values.
Syntax: par(…, no.readonly = FALSE)
Parameters:
- … :-arguments in tag = value form, or a list of tagged values. The tags must come from the names of graphical parameters described in the ‘Graphical Parameters’ section.
- no.readonly:-logical; if TRUE and there are no other arguments, only parameters are returned which can be set by a subsequent par() call on the same device.
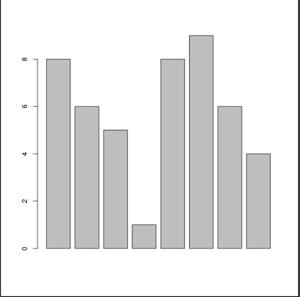
Let us first look at the initial plot so the difference is apparent.
Example: Initial plot
R
x<-c(8,6,5,1,8,9,6,4)
barplot(x)
|
Output:
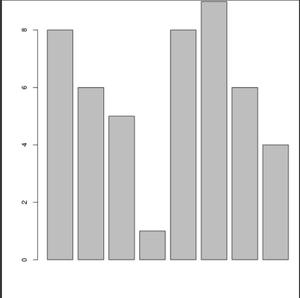
Now let us reduce the space around the plot using the par() function.
Example: Reducing space around the plot
R
x<-c(8,6,5,1,8,9,6,4)
par(mar = c(4, 4, 0.1, 0.1))
barplot(x)
|
Output:
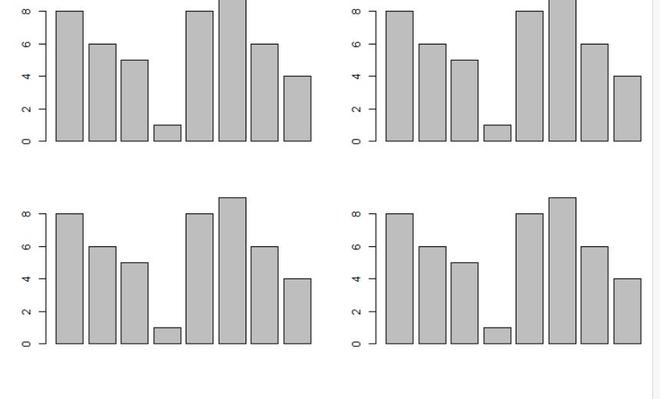
Now just a single plot, a plot with multiple other plots can also be managed by a single function. Let us first look at the initial plot so that the difference is apparent.
Example: Default plot
R
x<-c(8,6,5,1,8,9,6,4)
par(mfrow = c(2, 2))
barplot(x)
barplot(x)
barplot(x)
barplot(x)
|
Output:
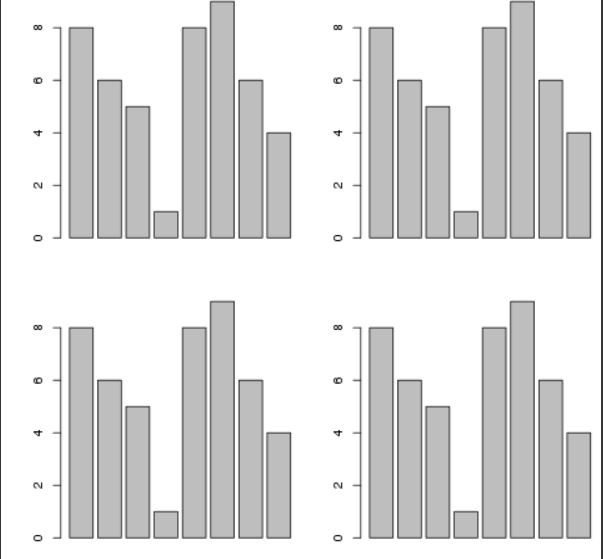
Now let us reduce the space around the plot using the par() function.
Example: Reduce the space around the plot
R
x<-c(8,6,5,1,8,9,6,4)
par(mfrow = c(2, 2))
par(mar = c(4, 4, 0.1, 0.1))
barplot(x)
barplot(x)
barplot(x)
barplot(x)
|
Output:
Like Article
Suggest improvement
Share your thoughts in the comments
Please Login to comment...