Random Forest Approach for Regression in R Programming
Last Updated :
10 Jul, 2020
Random Forest approach is a supervised learning algorithm. It builds the multiple decision trees which are known as forest and glue them together to urge a more accurate and stable prediction. The random forest approach is similar to the ensemble technique called as Bagging. In this approach, multiple trees are generated by bootstrap samples from training data and then we simply reduce the correlation between the trees. Performing this approach increases the performance of decision trees and helps in avoiding overriding. In this article, let’s learn to use a random forest approach for regression in R programming.
Features of Random Forest
- Aggregates many decision trees: A random forest is a collection of decision trees and thus, does not rely on a single feature and combines multiple predictions from each decision tree.
- Prevents overfitting: With multiple decision trees, each tree draws a sample random data giving the random forest more randomness to produce much better accuracy than decision trees.
Advantages of Random Forest
- Efficient: Random forests are much more efficient than decision trees while performing on large databases.
- Highly accurate: Random forests are highly accurate as they are collection of decision trees and each decision tree draws sample random data and in result, random forests produces higher accuracy on prediction.
- Efficient estimates of the test error: It makes efficient use of all predictive features and maintains accuracy even if the data is missing.
Disadvantages of Random Forest
- Requires different number of levels: Being a collection of decision trees, random forest requires different number of levels for much accurate and biased prediction of the training model.
- Requires a lot of memory: Training a large set of trees may require higher memory or parallelized memory.
Implementation of Random Forest Approach for Regression in R
The package randomForest in R programming is employed to create random forests. The forest it builds is a collection of decision trees. The function randomForest() is used to create and analyze random forests.
Syntax:
randomForest(formula, data)
Parameters:
formula: represents formula describing the model to be fitted
data: represents data frame containing the variables in the model
To know about more optional parameters, use command help(“randomForest”)
Example:
-
Step 1: Installing the required packages.
install.packages("randomForest")
|
-
Step 2: Loading the required package.
-
Step 3: In this example, let’s use airquality dataset present in R. Print the data set.
Output:
   Ozone Solar.R Wind Temp Month Day
1    41     190  7.4   67     5   1
2    36     118  8.0   72     5   2
3    12     149 12.6   74     5   3
4    18     313 11.5   62     5   4
5    NA      NA 14.3   56     5   5
6    28      NA 14.9   66     5   6
-
Step 4: Create random forest for regression
ozone.rf <- randomForest(Ozone ~ ., data = airquality, mtry = 3,
importance = TRUE, na.action = na.omit)
|
-
Step 5: Print Regression Models
Output:
Call:
 randomForest(formula = Ozone ~ ., data = airquality, mtry = 3,      importance = TRUE, na.action = na.omit)
               Type of random forest: regression
                     Number of trees: 500
No. of variables tried at each split: 3

          Mean of squared residuals: 296.4822
                    % Var explained: 72.98
-
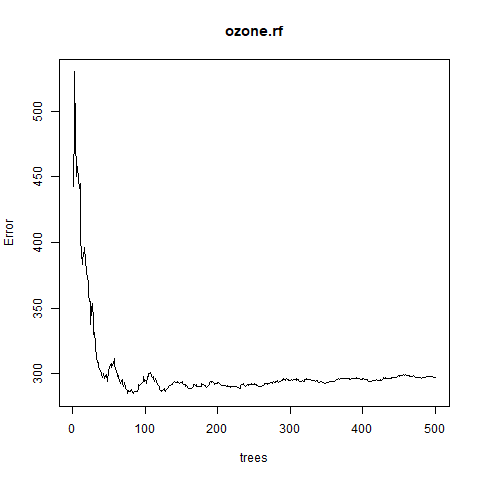
Step 6: Plotting the graph between error vs number of trees
png(file = "randomForestRegression.png")
plot(ozone.rf)
dev.off()
|
Output:
Like Article
Suggest improvement
Share your thoughts in the comments
Please Login to comment...