Rain Cloud Plots using Half Violin Plot with jittered data points in R
Last Updated :
28 Nov, 2021
In this article, we will discuss how to create Rain Cloud Plots using Half Violin Plot with jittered data points in R
Raincloud plots or Half Violin plots are basically used to visualize the distribution and the overall summary of the data at the same time. This plot is a combination of half violin plots with jittered points on top, boxplots and can be further enhanced by adding central measures of tendency, quartile ranges, etc.
Dataset Used
Here let’s use the “iris” dataset. This is an in-built dataset in R.
R
library(ggplot2)
library(plyr)
df <- iris
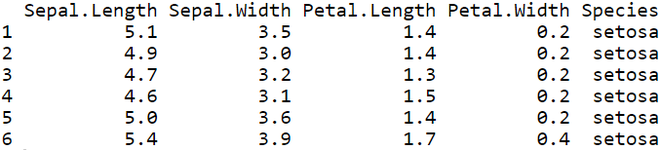
head(df)
|
Output:
Plotting a Raincloud using ggplot
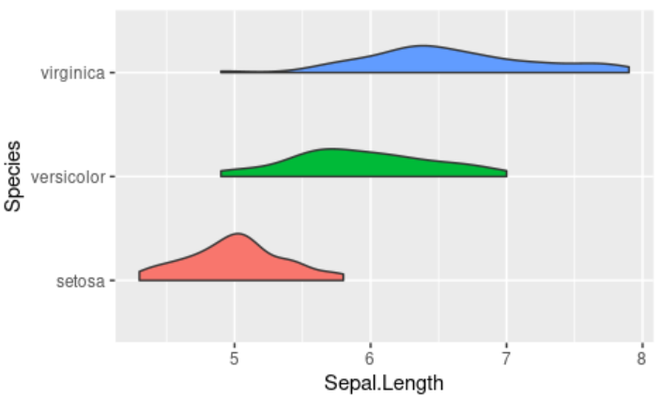
Example 1: Simple Raincloud plot
Let’s plot a Raincloud/Half Violin plot for Species vs Sepal Length of iris dataset.
R
library("ggplot2")
library("plyr")
df <- iris
ggplot(df, aes(Species, Sepal.Length, fill=Species)) +
geom_flat_violin() +
coord_flip() +
theme(legend.position = "none")
|
Output:
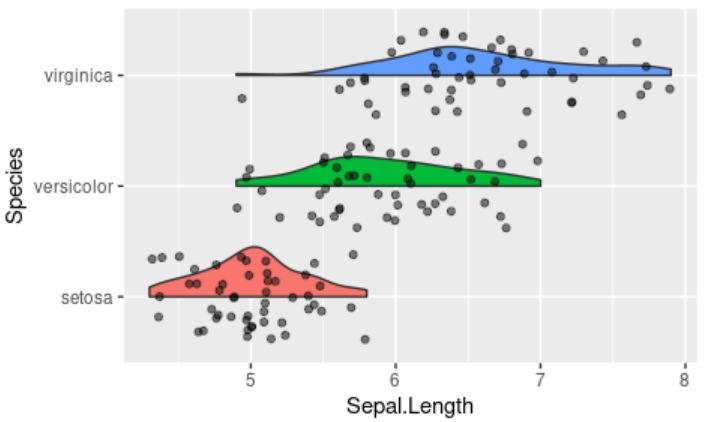
Example 2: Raincloud with jittered data points on top
Let’s check out how to add jittered data points on top of the Raincloud plot using the geom_jitter( ) function.
R
library("ggplot2")
library("plyr")
df <- iris
ggplot(df, aes(Species, Sepal.Length, fill=Species)) +
geom_flat_violin() +
coord_flip() + geom_jitter(alpha = 0.5,width = 0.15)+
theme(legend.position = "none")
|
Output:
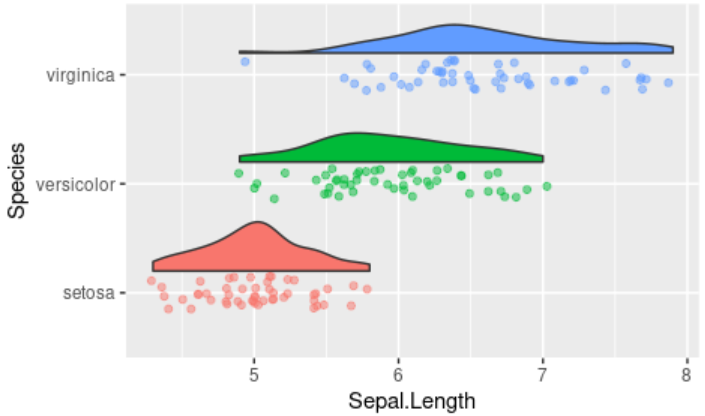
Example 3: Positioning the Raincloud plot
Let’s see how to adjust the position of the Half violin plots with respect to the jittered data points.
R
library("ggplot2")
library("plyr")
df < - iris
ggplot(df, aes(Species, Sepal.Length, fill=Species)) +
geom_flat_violin(position=position_nudge(x=.2, y=0)) +
coord_flip() + geom_jitter(alpha=0.5, width=0.15, aes(color=Species)) +
theme(legend.position="none")
|
Output:
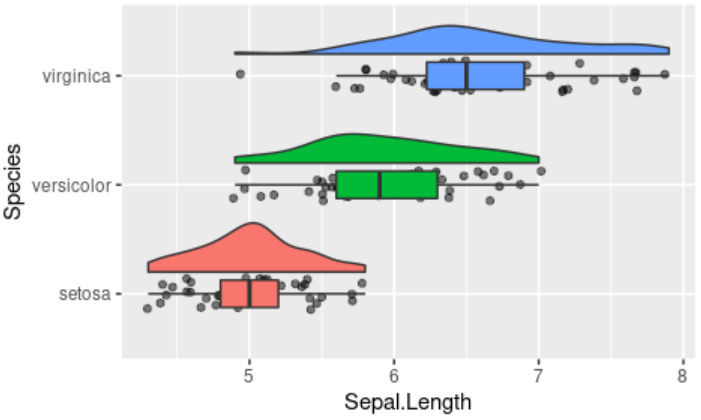
Example 4: Raincloud Plot with Boxplots
Let’s see how to plot a Boxplot alongside the half violin plot in order to get additional insights of the features.
R
library("ggplot2")
library("plyr")
df < - iris
ggplot(df, aes(Species, Sepal.Length, fill=Species)) +
geom_flat_violin(position = position_nudge(x = .2, y = 0)) +
coord_flip() + geom_jitter(alpha = 0.5,width = 0.15) +
theme(legend.position = "none") +
geom_boxplot( width = .25, outlier.shape = NA )
|
Output:
Like Article
Suggest improvement
Share your thoughts in the comments
Please Login to comment...