Quiver Plots using Plotly in Python
Last Updated :
05 Sep, 2020
A Plotly is a Python library that is used to design graphs, especially interactive graphs. It can plot various graphs and charts like histogram, barplot, boxplot, spreadplot, and many more. It is mainly used in data analysis as well as financial analysis. plotly is an interactive visualization library.
Quiver Plots
A quiver plot displays velocity vectors as arrows with the components (u, v) at the points (x, y). The quiver(x, y, u, v) plots vectors as arrows at the coordinates which are specified in each corresponding pair of elements in x and y. The main advantage of using a quiver plot is it can represent a wider range of magnitudes without having the arrows shrink to dots or overlap one another.
Syntax: create_quiver(x, y, u, v, scale=0.1, arrow_scale=0.3, angle=0.3490658503988659, scaleratio=None)
Parameters:
x: x coordinates of the arrow locations
y: y coordinates of the arrow locations
u: x components of the arrow vectors
v: y components of the arrow vectors
arrow_scale: value multiplied to length of barb to get length of arrowhead. Default = .3
angle: angle of arrowhead. Default = pi/9
Example:
Python3
import plotly.figure_factory as ff
import numpy as np
x = np.linspace(-2, 2, 60)
y = np.linspace(-1, 1, 60)
Y, X = np.meshgrid(x, y)
u = 1 - X**2 + Y
v = -1 + X - Y**2
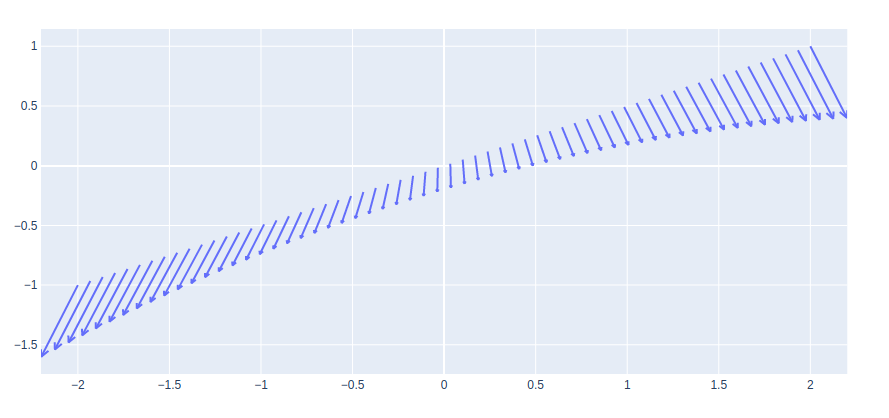
fig = ff.create_quiver(x, y, u, v, arrow_scale=.1)
fig.show()
|
Output:
Plotting Points with Quiver Plot
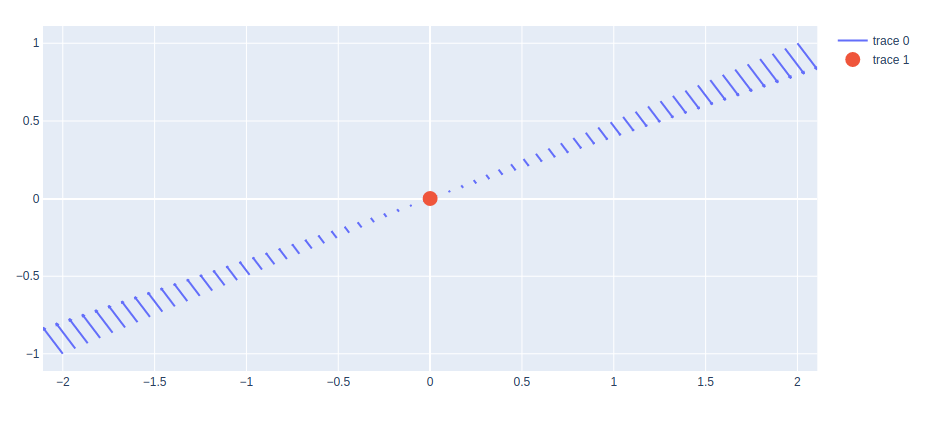
A quiver plot can be shown with the points with the help of the add_trace() method of graph_objects class. The scatter plot is added in such a way that shows the origin of the quivers.
Example:
Python3
import plotly.figure_factory as ff
import plotly.graph_objects as go
import numpy as np
x = np.linspace(-2, 2, 60)
y = np.linspace(-1, 1, 60)
Y, X = np.meshgrid(x, y)
u = np.cos(X)*Y
v = np.sin(X)*Y
fig = ff.create_quiver(x, y, u, v, arrow_scale=.1)
fig.add_trace(go.Scatter(x = [0], y = [0],
mode = 'markers',
marker_size = 15
))
fig.show()
|
Output:
Like Article
Suggest improvement
Share your thoughts in the comments
Please Login to comment...