Quick Table Calculation in Tableau
Last Updated :
01 Oct, 2020
In this article, we will learn how to apply quick table calculation in tableau worksheet to do further operations. For this first look into a term :
Tableau: Tableau is a very powerful data visualization tool that can be used by data analysts, scientists, statisticians, etc. to visualize the data and get a clear opinion based on the data analysis. Tableau is very famous as it can take in data and produce the required data visualization output in a very short time.
Dataset used in the given examples is Dataset.
For this we have to follow some steps :
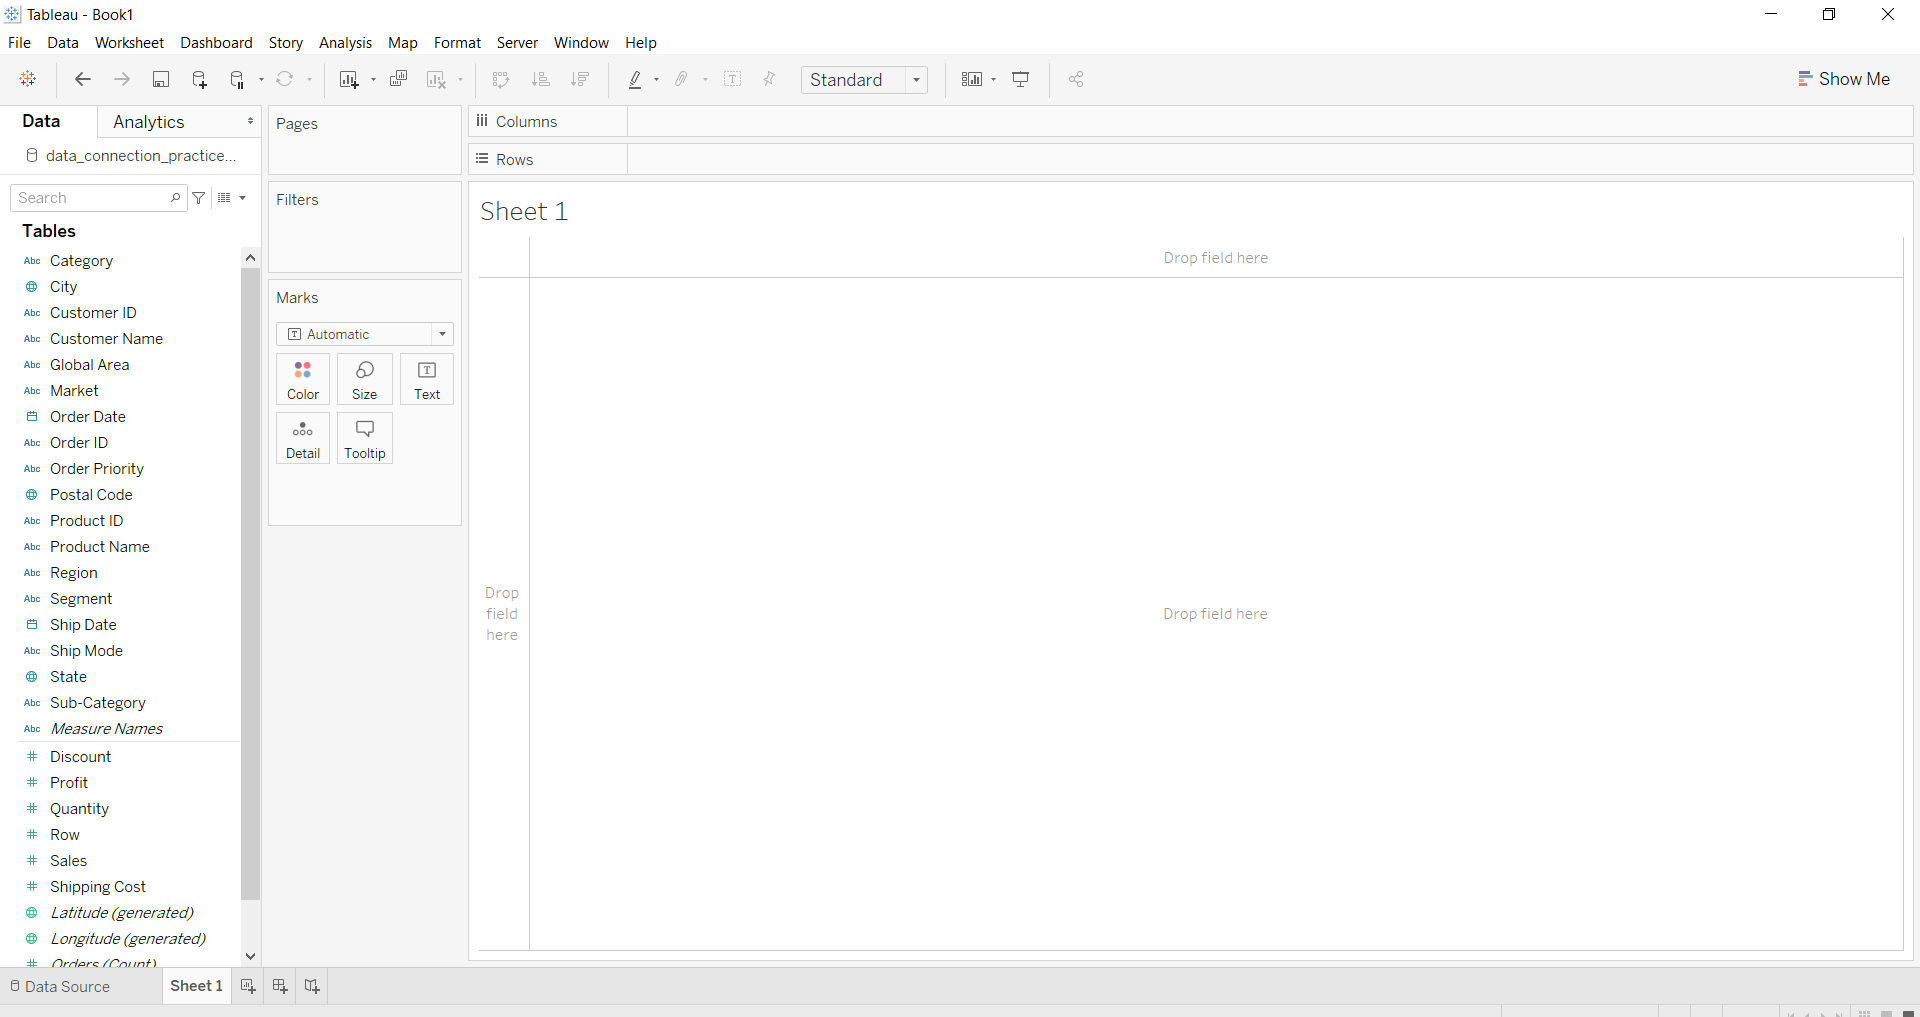
Open the Tableau tool and connect a dataset into it. Drag and drop the one sheet of the connected dataset. Click on sheet1 to open the tableau worksheet. On clicking Sheet1 you will get whole dataset attributes on the left side and a worksheet for work.
To apply quick table calculation you have to form a crosstab. Examples are given below:
Example 1: In this example, you can use the following steps :
- Drag and drop the Category and Subcategory fields in column and Sales field in row.
- Click on crosstab.
- Click on quick table calculation for sales.
- Select the percentage.
- And result is there.

Example 2: In this example, you can use the following steps :
- Drag and drop the Category and Subcategory fields in column and Sales and Profit fields in row.
- Click on crosstab.
- Click on quick table calculation for profit.
- Select the percentage.
- Click on quick table calculation for sales.
- Select the running total.
- Edit the calculation by table down.
- And result is there.
Example 3: In this example, you can use the following steps :
- Drag and drop the Category and Subcategory fields in column and Sales and Discount fields in row.
- Click on crosstab.
- Click on quick table calculation for Discount.
- Select the Rank.
- Click on quick table calculation for sales.
- Select the running total.
- Edit the calculation by pan down (shows the data in form of commutative value in each pan of category).
- Show the column grand total.
- And result is there.
Like Article
Suggest improvement
Share your thoughts in the comments
Please Login to comment...