Python | Working with PNG Images using Matplotlib
Last Updated :
15 Apr, 2019
Matplotlib is an amazing visualization library in Python for 2D plots of arrays. Matplotlib is a multi-platform data visualization library built on NumPy arrays and designed to work with the broader SciPy stack. It was introduced by John Hunter in the year 2002.
One of the greatest benefits of visualization is that it allows us visual access to huge amounts of data in easily digestible visuals. Matplotlib consists of several plots like line, bar, scatter, histogram etc.
In this article, we will see how can we work with PNG images using Matplotlib.
Code #1: Read a PNG image using Matplotlib
import matplotlib.pyplot as plt
import matplotlib.image as img
im = img.imread('imR.png')
plt.imshow(im)
|
Output:

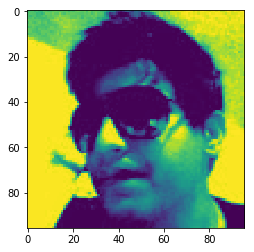
Code #2: Applying pseudocolor to image
Pseudocolor is useful for enhancing contrast of image.
import matplotlib.pyplot as plt
import matplotlib.image as img
im = img.imread('imR.png')
lum = im[:, :, 0]
plt.imshow(lum)
|
Output:
Code #3: We can provide another value to colormap with colorbar.
import matplotlib.pyplot as plt
import matplotlib.image as img
im = img.imread('imR.png')
lum = im[:, :, 0]
plt.imshow(lum, cmap ='hot')
plt.colorbar()
|
Output:

Interpolation Schemes:
Interpolation calculates what the color or value of a pixel “should” be and this needed when we resize the image but want the same information. There’s missing space when you resize image because pixels are discrete and interpolation is how you fill that space.
Code # 4: Interpolation
from PIL import Image
import matplotlib.pyplot as plt
img = Image.open('imR.png')
img.thumbnail((50, 50), Image.ANTIALIAS)
imgplot = plt.imshow(img)
|
Output:

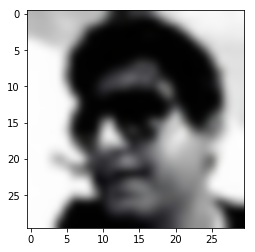
Code #6: Here, ‘bicubic’ value is used for interpolation.
import matplotlib.pyplot as plt
from PIL import Image
img = Image.open('imR.png')
img.thumbnail((30, 30), Image.ANTIALIAS)
imgplot = plt.imshow(img, interpolation ='bicubic')
|
Output:
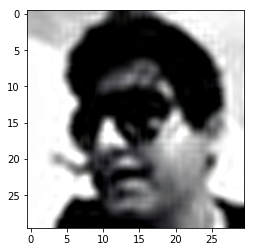
Code #7: ‘sinc’ value is used for interpolation.
from PIL import Image
import matplotlib.pyplot as plt
img = Image.open('imR.png')
img.thumbnail((30, 30), Image.ANTIALIAS)
imgplot = plt.imshow(img, interpolation ='sinc')
|
Output:
Reference: https://matplotlib.org/gallery/images_contours_and_fields/interpolation_methods.html
Like Article
Suggest improvement
Share your thoughts in the comments
Please Login to comment...