Python – Scroll through Plots
Last Updated :
09 Jan, 2024
In Python, we can plot graphs using many libraries and functions. Here in this article, our main focus is to add sliders to our plots. But before moving towards the slider, it is necessary to know how to plot a basic plot in Python using matplotlib.pyplot.
Scrolling through Plots Syntax
The basic syntax of a matplotlib.widget.Slider() is
Syntax: matplotlib.widgets.Slider(axis, label, val_min, val_max, valinit=0.5, valfmt=None, closed_min=True, closed_max=True, slider_min=None, slider_max=None, dragging=True, val_step=None, orientation=’horizontal’, **kwargs)
What is Scrolling through Plots in Python?
Scroll-through plots are the plots that update themselves as we change the scale of the plot using a slider. A slider can be added to a plot using matplotlib and plotly library. In this tutorial, we will learn about generating sliders using matplotlib.pyplot library. Scroll-through plots may not seem useful or necessary for every case but are surely a beneficial feature. There are cases where the data is huge and cannot fit into a dynamic plot and even if it fits there will be a collision between the points in the plot. Hence, using a slider will reduce collisions between the points and make it look presentable and clean. Also, it will be easy to study.
Slider() Function: Slider() function is a function that is present in matplotlib.widgets and helps the programmer add a slider into the plots.
Python Scrolling through Plots Examples
There are various examples of adding a scroll bar in the matplotlib graph in tkinter Here we are explaining some generally used examples of adding a scroll bar in the matplotlib graph in tkinter those are following.
- Scroll through Sliders
- Scroll through Multiple Sliders
- Scroll through Buttons
Add Scroll bar in Matplotlib Graph in tkinter Using Scroll through Sliders
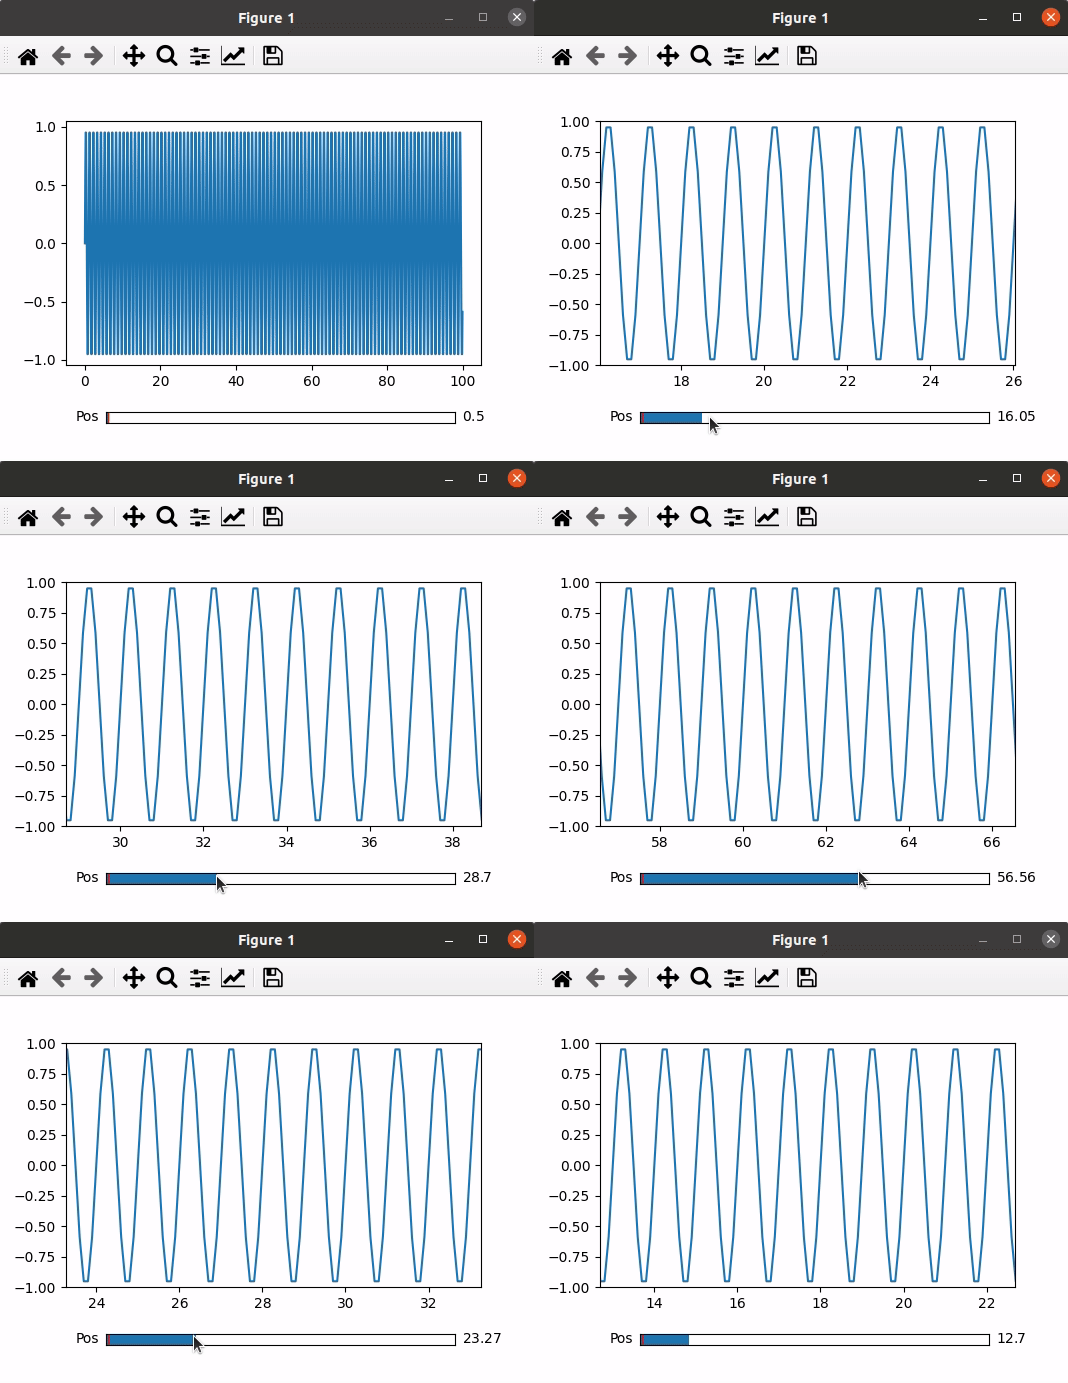
In this example code utilizes Matplotlib to create a simple plot with a slider. It imports necessary libraries, sets up the plot and axis using subplots, and adjusts the layout. The plot is based on dummy data, and a slider is added with a specified color. The slider’s position is controlled, updating the plot accordingly through the `update` function, which adjusts the x-axis range based on the slider’s value. The final plot is displayed with the slider allowing interactive control over the visible data range.
Python3
import numpy as np
import matplotlib.pyplot as plt
from matplotlib.widgets import Slider
Plot, Axis = plt.subplots()
plt.subplots_adjust(bottom=0.25)
t = np.arange(0.0, 100.0, 0.1)
s = np.sin(2*np.pi*t)
l = plt.plot(t, s)
slider_color = 'White'
axis_position = plt.axes([0.2, 0.1, 0.65, 0.03],
facecolor = slider_color)
slider_position = Slider(axis_position,
'Pos', 0.1, 90.0)
def update(val):
pos = slider_position.val
Axis.axis([pos, pos+10, -1, 1])
Plot.canvas.draw_idle()
slider_position.on_changed(update)
plt.show()
|
Output:

Add Scroll bar in Matplotlib Graph in tkinter Using Scroll through Multiple Sliders
In this example code creates an interactive plot using Matplotlib with two sliders to control frequency and amplitude of a sine wave. It imports necessary libraries, sets up the plot and sliders, and initializes the plot with dummy data. The sliders are positioned to adjust frequency and amplitude dynamically, and their values are updated using the `update` function. The resulting plot visualizes a sine wave whose frequency and amplitude can be interactively modified through the sliders.
Python3
import numpy as np
import matplotlib.pyplot as plt
from matplotlib.widgets import Slider
fig, ax = plt.subplots()
plt.subplots_adjust(bottom = 0.25)
t = np.arange(0.0, 1.0, 0.001)
a0 = 6
f0 = 3
s = a0*np.sin(2*np.pi*f0*t)
Plot, = plt.plot(t, s, lw = 3, color = 'green')
plt.axis([0, 1, -10, 10])
axcolor = "White"
frequency_axis = plt.axes([0.25, 0.1, 0.65, 0.03],
facecolor = axcolor)
amplitude_axis = plt.axes([0.25, 0.15, 0.65, 0.03],
facecolor = axcolor)
frequency_slider = Slider(frequency_axis, 'Freq',
0.1, 30.0, valinit = f0)
amplitude_slider = Slider(amplitude_axis, 'Amp',
0.1, 10.0, valinit = a0)
def update(val):
amp = amplitude_slider.val
freq = frequency_slider.val
Plot.set_ydata(amp*np.sin(2*np.pi*freq*t))
frequency_slider.on_changed(update)
amplitude_slider.on_changed(update)
plt.show()
|
Output:

Scroll backwards and forwards through Matplotlib plots
In this example the code creates a Matplotlib plot of a sine wave with an initial display range of 60 data points starting from index 0. It defines a function update_plot to shift the displayed portion of the data either forward or backward by a specified step. Two buttons, “Next” and “Previous,” are added to the plot using matplotlib.widgets.Button. Clicking these buttons triggers the update_plot function, allowing the user to scroll through the data in both directions. The plot dynamically adjusts to ensure the new display range stays within the data bounds
Python3
import numpy as np
import matplotlib.pyplot as plt
from matplotlib.widgets import Button
x = np.linspace(0, 10, 100)
y = np.sin(x)
display_range = 60
current_index = 0
fig, ax = plt.subplots()
line, = ax.plot(x[current_index:current_index + display_range], y[current_index:current_index + display_range], label='sin(x)')
def update_plot(forward=True):
global current_index
step = display_range if forward else -display_range
current_index += step
if current_index < 0:
current_index = 0
elif current_index + display_range > len(x):
current_index = len(x) - display_range
line.set_xdata(x[current_index:current_index + display_range])
line.set_ydata(y[current_index:current_index + display_range])
plt.draw()
ax_next_button = plt.axes([0.81, 0.01, 0.1, 0.05])
ax_prev_button = plt.axes([0.7, 0.01, 0.1, 0.05])
next_button = Button(ax_next_button, 'Next')
prev_button = Button(ax_prev_button, 'Previous')
next_button.on_clicked(lambda event: update_plot(forward=True))
prev_button.on_clicked(lambda event: update_plot(forward=False))
plt.show()
|
Output :
.gif)
Like Article
Suggest improvement
Share your thoughts in the comments
Please Login to comment...