Python SciPy – ndimage.spline_filter1d() function
Last Updated :
29 Aug, 2022
This method is used to calculate a 1-D spline filter along the given axis. These are filtered by a spline filter.
Syntax: scipy.ndimage.spline_filter1d(input, order=3, axis=-1, output=<class ‘numpy.float64’>)
Parameters
input: array_like – The input array
order: int – The order of the spline, default is 3.
axis: int, – The axis along which the spline filter is applied. Default is the last axis.
output: ndarray – The array in which to place the output, or the dtype of the returned array. Default is numpy.float64.
Example 1:
Python3
from scipy.ndimage import spline_filter1d
import matplotlib.pyplot as plt
import numpy as np
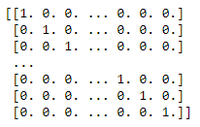
geek_image = np.eye(80)
geek_image[40, :] = 1.0
print(geek_image)
|
Output:
Example 2:
Python3
from scipy.ndimage import spline_filter1d
import matplotlib.pyplot as plt
import numpy as np
geek_image = np.eye(80)
geek_image[40, :] = 1.0
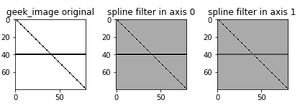
axis_0 = spline_filter1d(geek_image, axis=0)
axis_1 = spline_filter1d(geek_image, axis=1)
f, ax = plt.subplots(1, 3, sharex=True)
for ind, data in enumerate([[geek_image, "geek_image original"],
[axis_0, "spline filter in axis 0"],
[axis_1, "spline filter in axis 1"]]):
ax[ind].imshow(data[0], cmap='gray_r')
ax[ind].set_title(data[1])
plt.tight_layout()
plt.show()
|
Output:
Like Article
Suggest improvement
Share your thoughts in the comments
Please Login to comment...