Python Plotly – Subplots and Inset Plots
Last Updated :
28 Jan, 2022
Perquisites: Python Plotly
One of the most deceptively-powerful features of Plotly data visualization is the ability for a viewer to quickly analyze a sufficient amount of information about data when pointing the cursor over the point label appears.
In this article, we are going to see about the Subplots and Inset Plots in Plotly.
Syntax: layout = go.Layout( xaxis2 = dict( domain = [0-1], anchor = ‘axis’)
Where:
- xaxis2: list
- anchor: position_axis
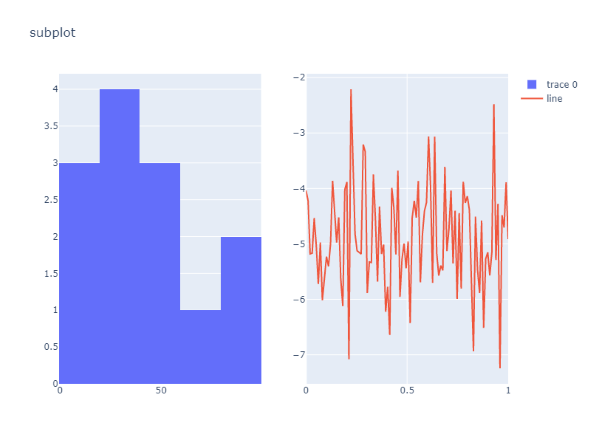
Example 1: Plotly Subplots
The subplots method provides a way to plot multiple plots on a single figure. This supports the concept of subplots which offer function in plotly.tools module. The function returns a Figure object. In this example, we are taking two data plots, the first one is a Line chart and another is a Histogram chart.
Python3
from plotly import tools
import plotly.graph_objs as go
from plotly.offline import iplot
import numpy as np
x1 = np.array([22, 87, 5, 43, 56, 73, 11,
42, 20, 5, 31, 27, 85])
N = 100
x_vals = np.linspace(0, 1, N)
y_vals = np.random.randn(N) - 5
chart1 = go.Histogram(x=x1)
chart2 = go.Scatter(
x=x_vals,
y=y_vals,
mode='lines',
name='line',
xaxis='x2',
yaxis='y2',
)
fig = tools.make_subplots(rows=1, cols=2)
fig.append_trace(chart1, 1, 1)
fig.append_trace(chart2, 1, 2)
fig['layout'].update(height=600, width=800,
title='subplot')
iplot(fig)
|
Output:
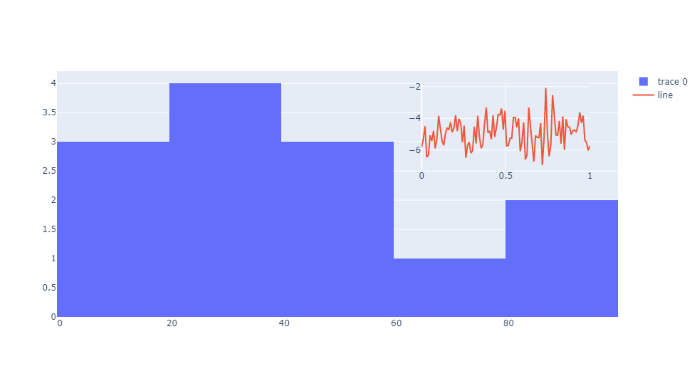
Example 2: Plotly Inset Plots
An Inset graph is a pictorial representation of values and data. It is a chart that is added to an existing chart in the given subplot graph. The dimensions of the inset chart are reduced so that the host plot remains at least partially visible in the graph plot. It provides us with the easiest way to read and analyze information from the document.
In this example, we are taking two data plots, first one is a Line chart and another is a Histogram chart which is assigned as chart1 and chart2 are passed as a list in the layout method. The x-axis and y-axis properties of inset trace to ‘x2’ and ‘y2’ respectively.
Now, an x-axis can be anchored to a y-axis, for example, xaxis2: {anchor: ‘y2’} means that xaxis2 joins yaxis2 at the origin. If anchors are set to free, the position attribute can then be used to move the axis to another position.
Python3
from plotly import tools
import plotly.graph_objs as go
from plotly.offline import iplot
import numpy as np
x1 = np.array([22, 87, 5, 43, 56, 73, 11,
42, 20, 5, 31, 27, 85])
N = 100
x_vals = np.linspace(0, 1, N)
y_vals = np.random.randn(N) - 5
chart1 = go.Histogram(x=x1)
chart2 = go.Scatter(
x=x_vals,
y=y_vals,
mode='lines',
name='line',
xaxis='x2',
yaxis='y2',
)
data = [chart1, chart2]
layout = go.Layout(
xaxis2=dict(
domain=[0.65, 0.95],
anchor='y2'
),
yaxis2=dict(
domain=[0.6, 0.95],
anchor='x2'
)
)
fig = go.Figure(data=data, layout=layout)
iplot(fig)
|
Output:
Like Article
Suggest improvement
Share your thoughts in the comments
Please Login to comment...