Python – Pearson’s Chi-Square Test
Last Updated :
26 Apr, 2023
In this article, we will perform Pearson’s Chi-Square test using a mathematical approach and then using Python’s SciPy module. It is an important statistic test in data science for categorical column selection. generally in data science projects, we select only those columns which are important and are not correlated with each other.
Pearson’s Chi-Square
Pearson’s Chi-Square is a statistical hypothesis test for independence between categorical variables. We will perform this chi-square test first using a mathematical approach and then using Python’s scipy module.
Let us know some terms before we understand the chi-square distribution
The Contingency Table
The Contingency table (also called crosstab) is used in statistics to summarise the relationship between several categorical variables. Here, we are taking a table that shows the number of men and women buying different types of pets.
| | dog | cat | bird | total |
| men | 207 | 282 | 241 | 730 |
| women | 234 | 242 | 232 | 708 |
| total | 441 | 524 | 473 | 1438 |
Null Hypothesis
A null Hypothesis is a general statistical statement or assumption about a population parameter that is assumed to be true Until we have sufficient evidence to reject it.
It is generally denoted by Ho.
Alternate Hypothesis
The Alternate Hypothesis is considered as competing of the null hypothesis. It is generally denoted by H1. The general goal of our hypothesis testing is to test the Alternative hypothesis against the null hypothesis.
P-Value
A P-value is used as a measure of evidence against the null hypothesis. If it is greater than our level of significance then we will accept our null hypothesis.
Chi-Square Mathematical Approach
The aim of this chi-square test is to conclude whether the two variables( gender and choice of pet ) are related to each other not.
Null hypothesis: We start by defining our null hypothesis (H0) which states that there is no relation between the variables.
Alternate hypothesis: It would state that there is a significant relationship between the two variables.
We will verify our hypothesis using these methods:
Using p-value:
We will define a significant factor to determine whether the relation between the variables is of considerable significance. Generally, a significant factor or alpha value of 0.05 is chosen. This alpha value denotes the probability of erroneously rejecting H0 when it is true. A lower alpha value is chosen in cases when we expect more precision. If the p-value for the test comes out to be strictly greater than the alpha value, then we will accept our H0.
Using chi-square value:
If our calculated value of chi-square is less than or equal to the tabular(also called critical) value of chi-square, then we will accept our H0.
Expected Values Table
Next, we prepare a similar table of calculated(or expected) values. To do this we need to calculate each item in the new table as:

The expected values table :
| | dog | cat | bird | total |
| men | 223.87343533 | 266.00834492 | 240.11821975 | 730 |
| women | 217.12656467 | 257.99165508 | 232.88178025 | 708 |
| total | 441 | 524 | 473 | 1438 |
Chi-Square Table: We prepare this table by calculating for element item through this formula.

The chi-square table:
| | observed (o) | calculated (c) | (o-c)^2 / c |
| | 207 | 223.87343533 | 1.2717579435607573 |
| | 282 | 266.00834492 | 0.9613722161954465 |
| | 241 | 240.11821975 | 0.003238139990850831 |
| | 234 | 217.12656467 | 1.3112758457617977 |
| | 242 | 257.99165508 | 0.991245364156322 |
| | 232 | 232.88178025 | 0.0033387601600580606 |
| Total | | | 4.542228269825232 |
From this table, we obtain the total of the last column, which gives us the calculated value of chi-square. Here the calculated value of chi-square is 4.542228269825232
Now, we need to find the critical value of the chi-square distribution. We can obtain this from the chi-square distribution table. To use this table, we need to know the degrees of freedom for the dataset.
The degrees of freedom is defined as : (no. of rows – 1) * (no. of columns – 1).
Hence, the degrees of freedom is (2-1) * (3-1) = 2
Now, let us look at the table and find the value corresponding to 2 degrees of freedom and a 0.05 significance factor
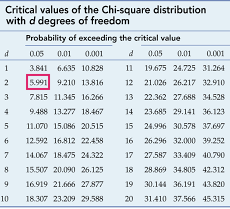
chi-square distribution table
The tabular or critical value of chi-square here is 5.991
Hence

So here, we will accept our null hypothesis H0, that is our variables do not have a significant relation.
Next, let us see how to perform this chi-square test in Python.
Performing the test using Python (scipy. stats) :
SciPy is an Open Source Python library, which is used in mathematics, engineering, scientific and technical computing.
Installation: To install scipy in our notebook, we will use this command.
pip install scipy
The chi2_contingency() function of scipy.stats module takes the contingency table element in 2d array format and it returns a tuple containing test statistics, p-value, degrees of freedom, and expected table(the one we created from the calculated values) in that order. Here, we need to compare the obtained p-value with an alpha value of 0.05.
python3
from scipy.stats import chi2_contingency
data = [[207, 282, 241], [234, 242, 232]]
stat, p, dof, expected = chi2_contingency(data)
alpha = 0.05
print("p value is " + str(p))
if p <= alpha:
print('Dependent (reject H0)')
else:
print('Independent (H0 holds true)')
|
Output :
p value is 0.1031971404730939
Independent (H0 holds true)
Since,
p-value > alpha
Therefore, we accept H0, which shows that our variables do not have a significant relation.
Like Article
Suggest improvement
Share your thoughts in the comments
Please Login to comment...