Python | Pandas Series.corr()
Last Updated :
17 Feb, 2019
Pandas series is a One-dimensional ndarray with axis labels. The labels need not be unique but must be a hashable type. The object supports both integer- and label-based indexing and provides a host of methods for performing operations involving the index.
Pandas Series.corr() function compute the correlation with other Series, excluding missing values.
Syntax: Series.corr(other, method=’pearson’, min_periods=None)
Parameter :
other : Series
method : {‘pearson’, ‘kendall’, ‘spearman’} or callable
min_periods : Minimum number of observations needed to have a valid result
Returns : correlation : float
Example #1: Use Series.corr() function to find the correlation of the given series object with the other.
import pandas as pd
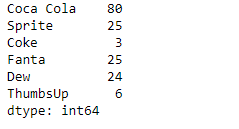
sr1 = pd.Series([80, 25, 3, 25, 24, 6])
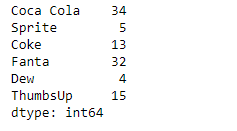
sr2 = pd.Series([34, 5, 13, 32, 4, 15])
index_ = ['Coca Cola', 'Sprite', 'Coke', 'Fanta', 'Dew', 'ThumbsUp']
sr1.index = index_
sr2.index = index_
print(sr1)
print(sr2)
|
Output :
Now we will use Series.corr() function to find the correlation between the underlying data of the given series object with the others.
result = sr1.corr(sr2)
print(result)
|
Output :
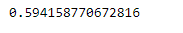
As we can see in the output, the Series.corr() function has successfully returned the correlation between the underlying data of the given series objects.
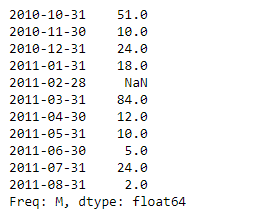
Example #2 : Use Series.corr() function to find the correlation of the given series object with the other. The series object contains some missing values.
import pandas as pd
sr1 = pd.Series([51, 10, 24, 18, None, 84, 12, 10, 5, 24, 2])
sr2 = pd.Series([11, 21, 8, 18, 65, 18, 32, 10, 5, 32, None])
index_ = pd.date_range('2010-10-09', periods = 11, freq ='M')
sr1.index = index_
sr2.index = index_
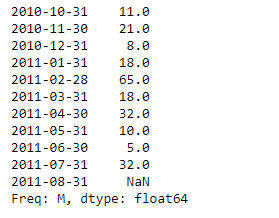
print(sr1)
print(sr2)
|
Output :
Now we will use Series.corr() function to find the correlation between the underlying data of the given series object with the others.
result = sr1.corr(sr2)
print(result)
|
Output :
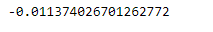
As we can see in the output, the Series.corr() function has successfully returned the correlation between the underlying data of the given series objects. Missing values are skipped while calculating the correlation between the objects.
Share your thoughts in the comments
Please Login to comment...