Python | Pandas Panel.count()
Last Updated :
01 Jan, 2019
In Pandas, Panel is a very important container for three-dimensional data. The names for the 3 axes are intended to give some semantic meaning to describing operations involving panel data and, in particular, econometric analysis of panel data.
Panel.count() function is used to return number of observations over requested axis.
Syntax: Panel.count(axis=’major’)
Parameters: axis : {‘items’, ‘major’, ‘minor’} or {0, 1, 2}
Returns: count of DataFrame
Code #1:
import pandas as pd
import numpy as np
df1 = pd.DataFrame({'a': ['Geeks', 'For', 'geeks', 'real'],
'b': [-11, +1.025, -114.48, 1333]})
data = {'item1':df1, 'item2':df1}
panel = pd.Panel.from_dict(data, orient ='minor')
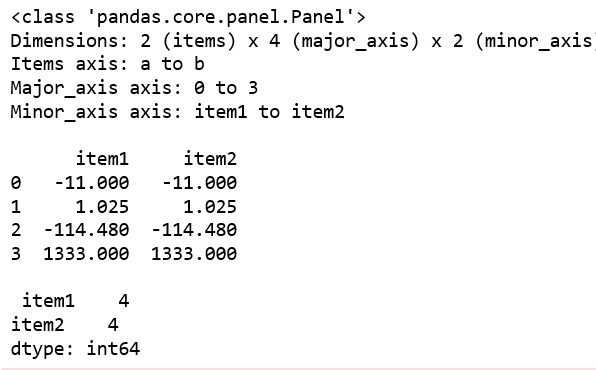
print(panel, "\n")
print(panel['b'])
print("\n", panel['b'].count())
|
Output:
Code #2:
import pandas as pd
import numpy as np
df1 = pd.DataFrame({'a': ['Geeks', 'For', 'geeks'],
'b': np.random.randn(3)})
data = {'item1':df1, 'item2':df1}
panel = pd.Panel.from_dict(data, orient ='minor')
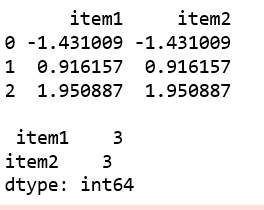
print(panel, "\n")
print(panel['b'])
df2 = pd.DataFrame({'b': [11, 12, 13]})
print("\n", panel['b'].count())
|
Output:
Like Article
Suggest improvement
Share your thoughts in the comments
Please Login to comment...