Python | Pandas dataframe.slice_shift()
Last Updated :
23 Nov, 2018
Python is a great language for doing data analysis, primarily because of the fantastic ecosystem of data-centric python packages. Pandas is one of those packages and makes importing and analyzing data much easier.
Pandas dataframe.slice_shift() function is Equivalent to shift without copying data. The shifted data will not include the dropped periods and the shifted axis will be smaller than the original. This function simply drops the specified number of periods over the given axis in a specified direction.
Syntax: DataFrame.slice_shift(periods=1, axis=0)
Parameters :
periods : Number of periods to move, can be positive or negative
Return : shifted : same type as caller
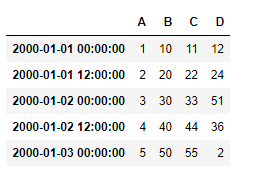
Example #1: Use slice_shift() function to shift the index axis by 2 periods in a time-series data
import pandas as pd
ind = pd.date_range('01/01/2000', periods = 5, freq ='12H')
df = pd.DataFrame({"A":[1, 2, 3, 4, 5],
"B":[10, 20, 30, 40, 50],
"C":[11, 22, 33, 44, 55],
"D":[12, 24, 51, 36, 2]}, index = ind)
df
|
Let’s use the dataframe.slice_shift() function to shift the index axis by 2 periods in positive direction
df.slice_shift(2, axis = 0)
|
Output :
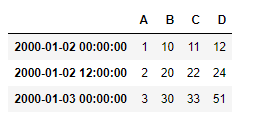
Notice the index labels, first two labels are dropped but the data has been shifted by two periods in the positive direction.
We can also shift the index axis in negative direction by some periods
df.slice_shift(-2, axis = 0)
|
Output :
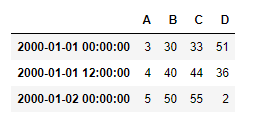
Notice in the output, the data points has been shifted in the negative direction (i.e. upward) by 2 periods and the last two index labels has been removed.
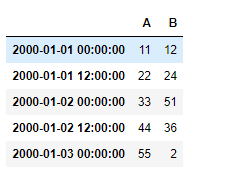
Example #2: Use slice_shift() function to shift the column axis by 2 periods in a time-series data
import pandas as pd
ind = pd.date_range('01/01/2000', periods = 5, freq ='12H')
df = pd.DataFrame({"A":[1, 2, 3, 4, 5],
"B":[10, 20, 30, 40, 50],
"C":[11, 22, 33, 44, 55],
"D":[12, 24, 51, 36, 2]}, index = ind)
df.slice_shift(2, axis = 1)
|
Output :
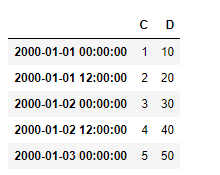
In the output, we can see the first two column labels are removed and the data point along the column axis has been shifted by 2 periods in the positive direction.
We can also shift the column axis in negative direction by some periods
df.slice_shift(-2, axis = 0)
|
Output :
In the output, we can see the last two column labels are removed and the data point along the column axis has been shifted by 2 periods in the negative direction (i.e. left).
Like Article
Suggest improvement
Share your thoughts in the comments
Please Login to comment...