Python | Pandas dataframe.skew()
Last Updated :
15 Jul, 2022
Python is a great language for doing data analysis, primarily because of the fantastic ecosystem of data-centric python packages. Pandas is one of those packages and makes importing and analyzing data much easier.
Pandas dataframe.skew() function return unbiased skew over requested axis Normalized by N-1. Skewness is a measure of the asymmetry of the probability distribution of a real-valued random variable about its mean. For more information on skewness, refer this link.
Pandas: DataFrame.skew(axis=None, skipna=None, level=None, numeric_only=None, **kwargs)
Parameters :
axis : {index (0), columns (1)}
skipna : Exclude NA/null values when computing the result.
level : If the axis is a MultiIndex (hierarchical), count along a particular level, collapsing into a Series
numeric_only : Include only float, int, boolean columns. If None, will attempt to use everything, then use only numeric data. Not implemented for Series.
Return : skew : Series or DataFrame (if level specified)
For link to the CSV file used in the code, click here
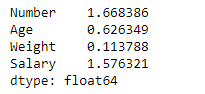
Example #1: Use skew() function to find the skewness in data over the index axis.
import pandas as pd
df = pd.read_csv("nba.csv")
df
|

Let’s use the dataframe.skew() function to find skewness
df.skew(axis = 0, skipna = True)
|
Output :
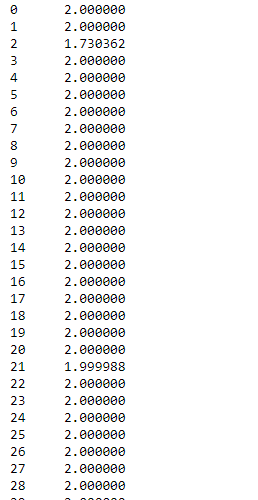
Example #2: Use skew() function to find the skewness of the data over the column axis.
import pandas as pd
df = pd.read_csv("nba.csv")
df.skew(axis = 1, skipna = True)
|
Output :
Like Article
Suggest improvement
Share your thoughts in the comments
Please Login to comment...