Python | Pandas dataframe.resample()
Last Updated :
22 Oct, 2019
Python is a great language for doing data analysis, primarily because of the fantastic ecosystem of data-centric python packages. Pandas is one of those packages and makes importing and analyzing data much easier.
Pandas dataframe.resample() function is primarily used for time series data.
A time series is a series of data points indexed (or listed or graphed) in time order. Most commonly, a time series is a sequence taken at successive equally spaced points in time. It is a Convenience method for frequency conversion and resampling of time series. Object must have a datetime-like index (DatetimeIndex, PeriodIndex, or TimedeltaIndex), or pass datetime-like values to the on or level keyword.
Syntax : DataFrame.resample(rule, how=None, axis=0, fill_method=None, closed=None, label=None, convention=’start’, kind=None, loffset=None, limit=None, base=0, on=None, level=None)
Parameters :
rule : the offset string or object representing target conversion
axis : int, optional, default 0
closed : {‘right’, ‘left’}
label : {‘right’, ‘left’}
convention : For PeriodIndex only, controls whether to use the start or end of rule
loffset : Adjust the resampled time labels
base : For frequencies that evenly subdivide 1 day, the “origin” of the aggregated intervals. For example, for ‘5min’ frequency, base could range from 0 through 4. Defaults to 0.
on : For a DataFrame, column to use instead of index for resampling. Column must be datetime-like.
level : For a MultiIndex, level (name or number) to use for resampling. Level must be datetime-like.
Resampling generates a unique sampling distribution on the basis of the actual data. We can apply various frequency to resample our time series data. This is a very important technique in the field of analytics.
Most commonly used time series frequency are –
W : weekly frequency
M : month end frequency
SM : semi-month end frequency (15th and end of month)
Q : quarter end frequency
There are many other types of time series frequency available. Let’s see how to apply these time series frequency on data and resample it.
For link to CSV file Used in Code, click here
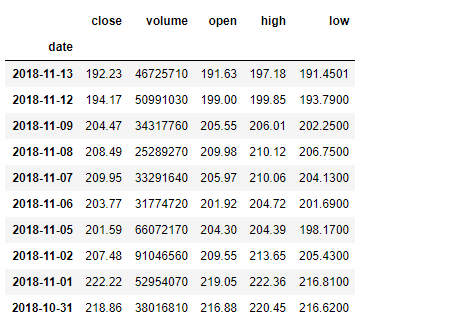
This is a stock price data of Apple for a duration of 1 year from (13-11-17) to (13-11-18)
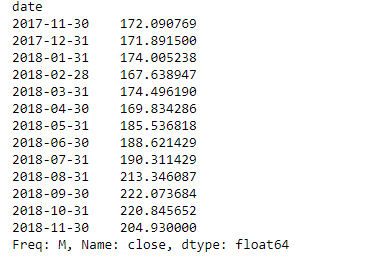
Example #1: Resampling the data on monthly frequency
import pandas as pd
df = pd.read_csv("apple.csv", parse_dates =["date"], index_col ="date")
df[:10]
|
monthly_resampled_data = df.close.resample('M').mean()
monthly_resampled_data
|
Output :
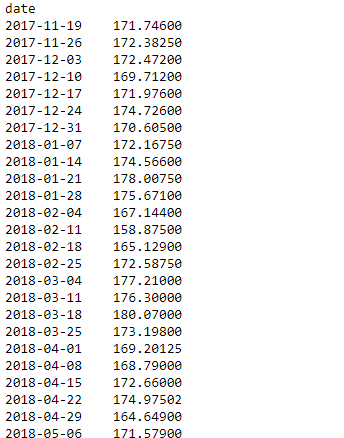
Example #2: Resampling the data on weekly frequency
import pandas as pd
df = pd.read_csv("apple.csv", parse_dates =["date"], index_col ="date")
weekly_resampled_data = df.open.resample('W').mean()
weekly_resampled_data
|
Output :
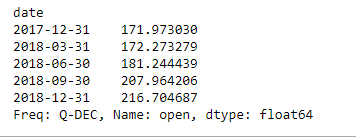
Example #3: Resampling the data on Quarterly frequency
import pandas as pd
df = pd.read_csv("apple.csv", parse_dates =["date"], index_col ="date")
Quarterly_resampled_data = df.open.resample('Q').mean()
Quarterly_resampled_data
|
Output :
Share your thoughts in the comments
Please Login to comment...