Python | Pandas Dataframe.plot.bar
Last Updated :
06 Jan, 2019
Python is a great language for doing data analysis, primarily because of the fantastic ecosystem of data-centric python packages. Pandas is one of those packages and makes importing and analyzing data much easier.
Pandas DataFrame.plot.bar() plots the graph vertically in form of rectangular bars.
Syntax : DataFrame.plot.bar(x=None, y=None, **kwds)
Parameters:
x : (label or position, optional) Allows plotting of one column versus another. If not specified, the index of the DataFrame is used.
y : (label or position, optional) Allows plotting of one column versus another. If not specified, all numerical columns are used.
**kwds : Additional keyword arguments
Returns: matplotlib.axes.Axes or np.ndarray of them
Example #1: Using DataFrame.plot.bar() to plot the graph vertically in form of rectangular bars
import matplotlib.pyplot
import pandas as pd
import numpy as np
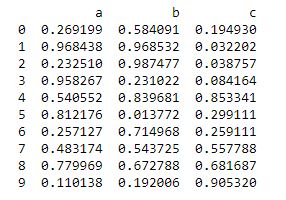
df = pd.DataFrame(np.random.rand(10, 3), columns =['a', 'b', 'c'])
print(df)
|
Now we will use a function DataFrame.plot.bar() to plot a graph vertically in form of rectangular bars
Output:

Example #2: Using DataFrame.plot.bar() to plot the graph vertically in form of rectangular bars.
import matplotlib.pyplot
import pandas as pd
import numpy as np
df = pd.DataFrame(np.random.rand(10, 10),
columns =['a', 'b', 'c', 'd', 'e', 'f', 'g', 'h', 'i', 'j'])
df
|

Now we will use a function DataFrame.plot.bar() to plot a graph vertically in form of rectangular bars
Output :

Like Article
Suggest improvement
Share your thoughts in the comments
Please Login to comment...