Python | Pandas dataframe.cumsum()
Last Updated :
16 Nov, 2018
Python is a great language for doing data analysis, primarily because of the fantastic ecosystem of data-centric python packages. Pandas is one of those packages and makes importing and analyzing data much easier.
Pandas dataframe.cumsum() is used to find the cumulative sum value over any axis. Each cell is populated with the cumulative sum of the values seen so far.
Syntax: DataFrame.cumsum(axis=None, skipna=True, *args, **kwargs)
Parameters:
axis : {index (0), columns (1)}
skipna : Exclude NA/null values. If an entire row/column is NA, the result will be NA
Returns: cumsum : Series
Example #1: Use cumsum() function to find the cumulative sum of the values along the index axis.
import pandas as pd
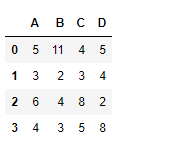
df = pd.DataFrame({"A":[5, 3, 6, 4],
"B":[11, 2, 4, 3],
"C":[4, 3, 8, 5],
"D":[5, 4, 2, 8]})
df
|
Output :
Now find the cumulative sum of the values over the index axis
Output :

Example #2: Use cumsum() function to find the cumulative sum of the values seen so far along the column axis.
import pandas as pd
df = pd.DataFrame({"A":[5, 3, 6, 4],
"B":[11, 2, 4, 3],
"C":[4, 3, 8, 5],
"D":[5, 4, 2, 8]})
df.cumsum(axis = 1)
|
Output :

Example #3: Use cumsum() function to find the cumulative sum of the values seen so far along the index axis in a data frame with NaN value present in dataframe.
import pandas as pd
df = pd.DataFrame({"A":[5, 3, None, 4],
"B":[None, 2, 4, 3],
"C":[4, 3, 8, 5],
"D":[5, 4, 2, None]})
df.cumsum(axis = 0, skipna = True)
|
Output :
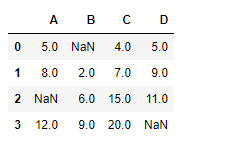
The output is a dataframe with cells containing the cumulative sum of the values seen so far along the index axis. Any Nan value in the dataframe is skipped.
Like Article
Suggest improvement
Share your thoughts in the comments
Please Login to comment...