Python OpenCV – cv2.calcHist method
Last Updated :
03 Jan, 2023
OpenCV provides us with the cv2.calcHist() function to calculate the image histograms. We could apply it to calculate the histogram of the constituent color channels (blue, green, and red) of the image. When we read the image using cv2.imread() method, the image read is in BGR format. We could use the below syntax for the cv2.calcHist() function.
cv2.calcHist() function:
Syntax: cv2.calcHist(images, channels, mask, histSize, ranges[, hist[, accumulate]])
Parameters:
- images: list of images as numpy arrays. All images must be of the same dtype and same size.
- channels: list of the channels used to calculate the histograms.
- mask: optional mask (8 bit array) of the same size as the input image.
- histSize: histogram sizes in each dimension
- ranges: Array of the dims arrays of the histogram bin boundaries in each dimension
- hist: Output histogram
- accumulate: accumulation flag, enables to compute a single histogram from several sets of arrays.
Return: It returns an array of histogram points of dtype float32.
Let’s understand the cv2.calcHist() function with the help of some Python examples.
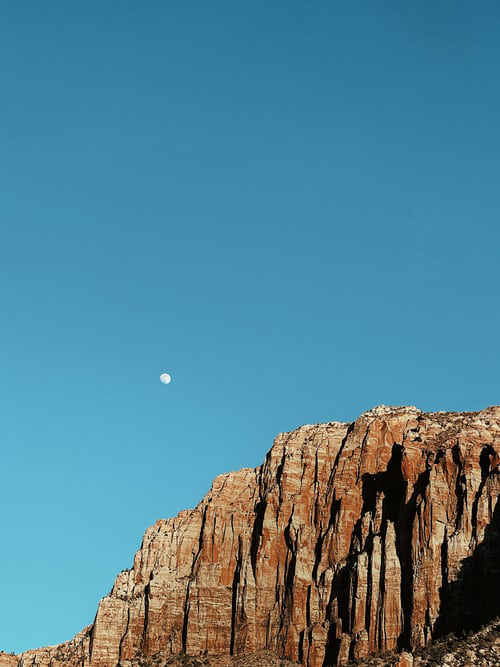
The following image is used as an input image in the examples below.
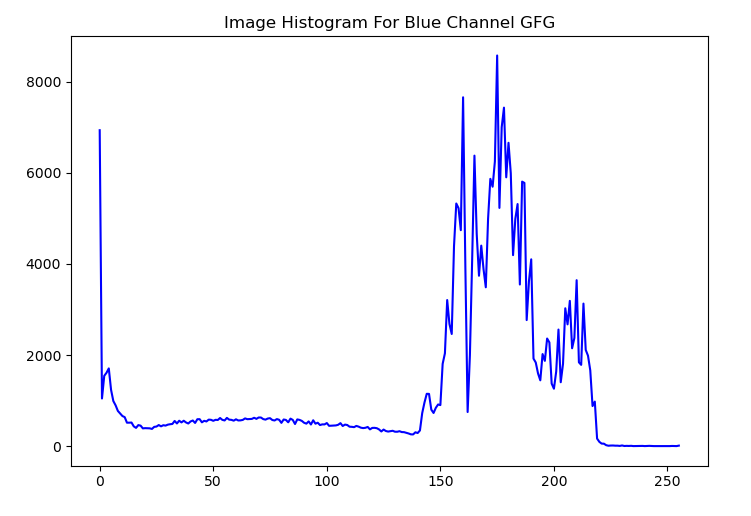
Example 1:
In this example, we calculate the histogram of the blue color channel of the input image “mountain.jpg” using cv2.calcHist() function. We pass the parameter channels = [0] to calculate the histogram of the blue channel. We also plot the histogram using Matplotlib.
Python3
%matplotlib inline
import cv2
import numpy as np
from matplotlib import pyplot as plt
img = cv2.imread('mountain.jpg')
hist = cv2.calcHist([img],[0],None,[256],[0,256])
plt.plot(hist, color='b')
plt.title('Image Histogram For Blue Channel GFG')
plt.show()
|
Output:
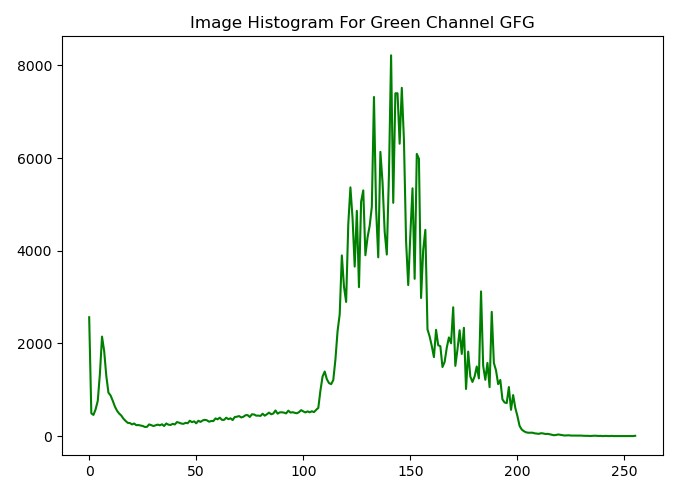
Example 2:
In this example, we calculate the histogram of the green color channel of the input image “mountain.jpg” using cv2.calcHist() function. We pass the parameter channels = [1] to calculate the histogram of the green channel. We also plot the histogram using Matplotlib.
Python3
%matplotlib inline
import cv2
import numpy as np
from matplotlib import pyplot as plt
img = cv2.imread('mountain.jpg')
hist = cv2.calcHist([img],[1],None,[256],[0,256])
plt.plot(hist, color='g')
plt.title('Image Histogram For Green Channel GFG')
plt.show()
|
Output:
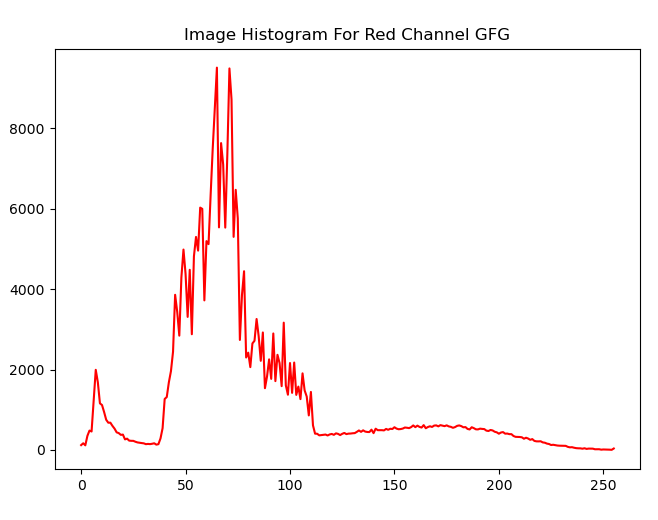
Example 3:
In this example, we calculate the histogram of the red color channel of the input image “mountain.jpg” using cv2.calcHist() function. We pass the parameter channels = [2] to calculate the histogram of the red channel. We also plot the histogram using Matplotlib.
Python3
%matplotlib inline
import cv2
import numpy as np
from matplotlib import pyplot as plt
img = cv2.imread('mountain.jpg')
hist = cv2.calcHist([img],[2],None,[256],[0,256])
plt.plot(hist, color='r')
plt.title('Image Histogram For Red Channel GFG')
plt.show()
|
Output:
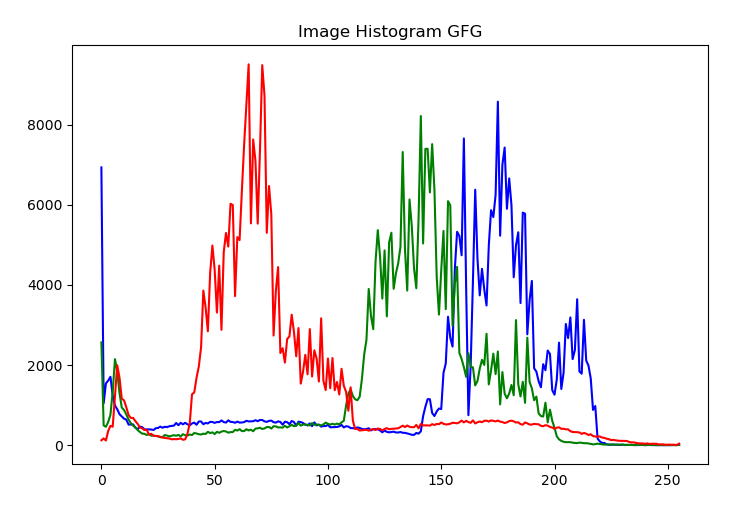
Example 4:
In this example, we calculate the histogram of all three color channels of the input image “mountain.jpg” using cv2.calcHist() function. We use a for loop to iterate over all three color channels. We also plot the histogram using Matplotlib.
Python3
%matplotlib inline
import cv2
import numpy as np
from matplotlib import pyplot as plt
img = cv2.imread('mountain.jpg')
colors = ('b','g','r')
for i,color in enumerate(colors):
hist = cv2.calcHist([img],[i],None,[256],[0,256])
plt.plot(hist,color = color)
plt.title('Image Histogram GFG')
plt.show()
|
Output:
Like Article
Suggest improvement
Share your thoughts in the comments
Please Login to comment...