Python – Coefficient of Determination-R2 score
Last Updated :
10 Jan, 2023
Coefficient of determination also called as R2 score is used to evaluate the performance of a linear regression model. It is the amount of the variation in the output dependent attribute which is predictable from the input independent variable(s). It is used to check how well-observed results are reproduced by the model, depending on the ratio of total deviation of results described by the model.
Mathematical Formula:
R2= 1- SSres / SStot
Where,
SSres is the sum of squares of the residual errors.
SStot is the total sum of the errors.
Interpretation of R2 score:
Assume R2 = 0.68
It can be referred that 68% of the changeability of the dependent output attribute can be explained by the model while the remaining 32 % of the variability is still unaccounted for.
R2 indicates the proportion of data points which lie within the line created by the regression equation. A higher value of R2 is desirable as it indicates better results.
Examples
Case 1 Model gives accurate results
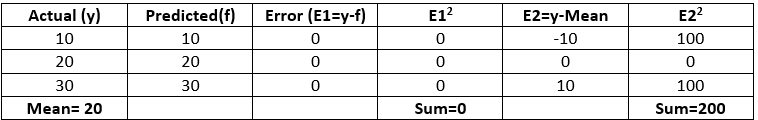
R2 = 1- 0/200 = 1
Case 2 Model gives same results always
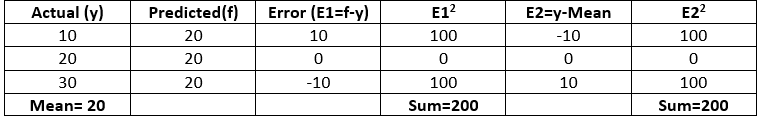
R2 = 1- 200/200 = 0
Case 3 Model gives ambiguous results
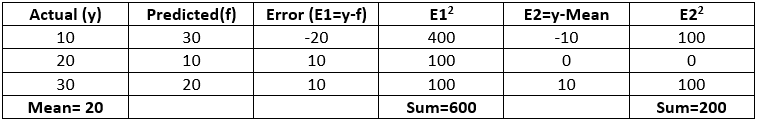
R2 = 1- 600/200 = -2
We can import r2_score from sklearn.metrics in Python to compute R2 score.
Python Implementation:
Code 1: Import r2_score from sklearn.metrics
from sklearn.metrics import r2_score
|
Code 2: Calculate R2 score for all the above cases.
y =[10, 20, 30]
f =[10, 20, 30]
r2 = r2_score(y, f)
print('r2 score for perfect model is', r2)
|
Output:
r2 score for perfect model is 1.0
y =[10, 20, 30]
f =[20, 20, 20]
r2 = r2_score(y, f)
print('r2 score for a model which predicts mean value always is', r2)
|
Output:
r2 score for a model which predicts mean value always is 0.0
Code 3:
y = [10, 20, 30]
f = [30, 10, 20]
r2 = r2_score(y, f)
print('r2 score for a worse model is', r2)
|
Output:
r2 score for a worse model is -2.0
Conclusion:
- The best possible score is 1 which is obtained when the predicted values are the same as the actual values.
- R2 score of baseline model is 0.
- During the worse cases, R2 score can even be negative.
Share your thoughts in the comments
Please Login to comment...