Python Bokeh – Plotting Horizontal Bar Graphs
Last Updated :
03 Jul, 2020
Bokeh is a Python interactive data visualization. It renders its plots using HTML and JavaScript. It targets modern web browsers for presentation providing elegant, concise construction of novel graphics with high-performance interactivity.
Bokeh can be used to plot horizontal bar graphs. Plotting horizontal bar graphs can be done using the hbar() method of the plotting module.
plotting.figure.hbar()
Syntax : hbar(parameters)
Parameters :
- y : y-coordinates of the center of the horizontal bars
- height : thickness of the horizontal bars
- right : x-coordinates of the right edges
- left : x-coordinates of the left edges, default is 0
- fill_alpha : fill alpha value of the horizontal bars
- fill_color : fill color value of the horizontal bars
- hatch_alpha : hatch alpha value of the horizontal bars, default is 1
- hatch_color : hatch color value of the horizontal bars, default is black
- hatch_extra : hatch extra value of the horizontal bars
- hatch_pattern : hatch pattern value of the horizontal bars
- hatch_scale : hatch scale value of the horizontal bars, default is 12
- hatch_weight : hatch weight value of the horizontal bars, default is 1
- line_alpha : percentage value of line alpha, default is 1
- line_cap : value of line cap for the line, default is butt
- line_color : color of the line, default is black
- line_dash : value of line dash such as :
- solid
- dashed
- dotted
- dotdash
- dashdot
default is solid
- line_dash_offset : value of line dash offset, default is 0
- line_join : value of line join, default in bevel
- line_width : value of the width of the line, default is 1
- name : user-supplied name for the model
- tags : user-supplied values for the model
Other Parameters :
- alpha : sets all alpha keyword arguments at once
- color : sets all color keyword arguments at once
- legend_field : name of a column in the data source that should be used
- legend_group : name of a column in the data source that should be used
- legend_label : labels the legend entry
- muted : determines whether the glyph should be rendered as muted or not, default is False
- name : optional user-supplied name to attach to the renderer
- source : user-supplied data source
- view : view for filtering the data source
- visible : determines whether the glyph should be rendered or not, default is True
- x_range_name : name of an extra range to use for mapping x-coordinates
- y_range_name : name of an extra range to use for mapping y-coordinates
- level : specifies the render level order for this glyph
Returns : an object of class GlyphRenderer
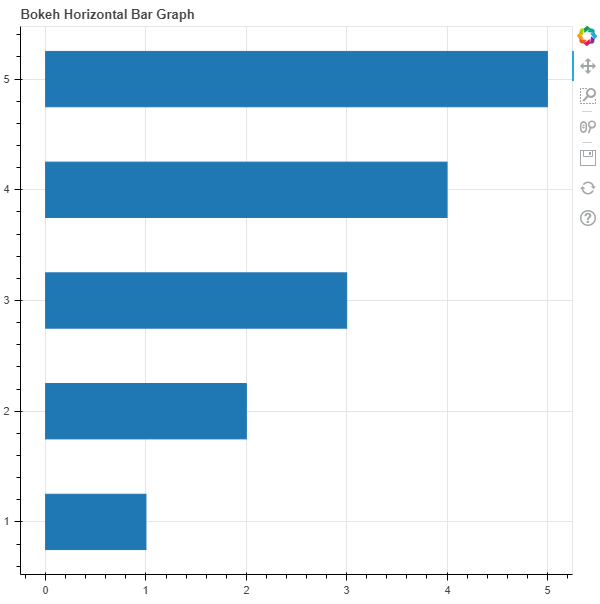
Example 1 :In this example we will be using the default values for plotting the graph.
from bokeh.plotting import figure, output_file, show
output_file("gfg.html")
graph = figure(title = "Bokeh Horizontal Bar Graph")
y = [1, 2, 3, 4, 5]
right = [1, 2, 3, 4, 5]
height = 0.5
graph.hbar(y,
right = right,
height = height)
show(graph)
|
Output :
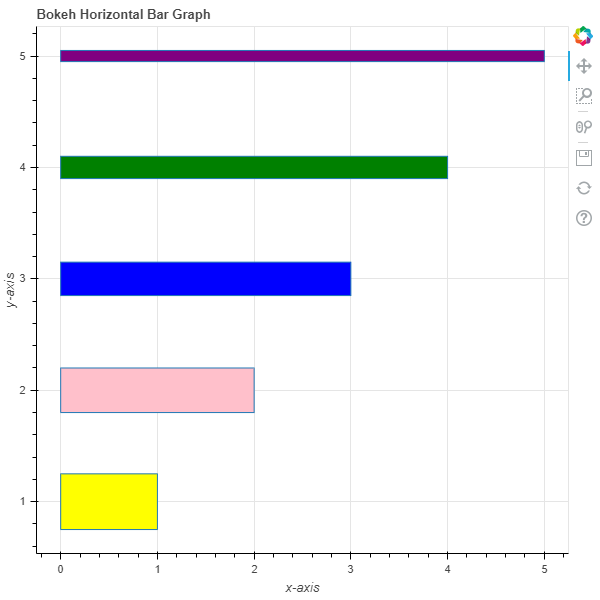
Example 2 :In this example we will be plotting horizontal bars with different parameters.
from bokeh.plotting import figure, output_file, show
output_file("gfg.html")
graph = figure(title = "Bokeh Horizontal Bar Graph")
graph.xaxis.axis_label = "x-axis"
graph.yaxis.axis_label = "y-axis"
y = [1, 2, 3, 4, 5]
right = [1, 2, 3, 4, 5]
height = [0.5, 0.4, 0.3, 0.2, 0.1]
fill_color = ["yellow", "pink", "blue", "green", "purple"]
graph.hbar(y,
right = right,
height = height,
fill_color = fill_color)
show(graph)
|
Output :
Like Article
Suggest improvement
Share your thoughts in the comments
Please Login to comment...