Python Bokeh – Plotting Diamonds on a Graph
Last Updated :
03 Jul, 2020
Bokeh is a Python interactive data visualization. It renders its plots using HTML and JavaScript. It targets modern web browsers for presentation providing elegant, concise construction of novel graphics with high-performance interactivity.
Bokeh can be used to plot diamonds on a graph. Plotting diamonds on a graph can be done using the diamond() method of the plotting module.
plotting.figure.diamond()
Syntax : diamond(parameters)
Parameters :
- x : x-coordinates of the center of the diamond markers
- y : y-coordinates of the center of the diamond markers
- size : diameter of the diamond markers, default is 4
- angle : angle of rotation of the diamond markers, default is 0
- angle_units : unit of the angle, default is rad
- fill_alpha : fill alpha value of the diamond markers
- fill_color : fill color value of the diamond markers
- line_alpha : percentage value of line alpha, default is 1
- line_cap : value of line cap for the line, default is butt
- line_color : color of the line, default is black
- line_dash : value of line dash such as :
- solid
- dashed
- dotted
- dotdash
- dashdot
default is solid
- line_dash_offset : value of line dash offset, default is 0
- line_join : value of line join, default in bevel
- line_width : value of the width of the line, default is 1
- name : user-supplied name for the model
- tags : user-supplied values for the model
Other Parameters :
- alpha : sets all alpha keyword arguments at once
- color : sets all color keyword arguments at once
- legend_field : name of a column in the data source that should be used
- legend_group : name of a column in the data source that should be used
- legend_label : labels the legend entry
- muted : determines whether the glyph should be rendered as muted or not, default is False
- name : optional user-supplied name to attach to the renderer
- source : user-supplied data source
- view : view for filtering the data source
- visible : determines whether the glyph should be rendered or not, default is True
- x_range_name : name of an extra range to use for mapping x-coordinates
- y_range_name : name of an extra range to use for mapping y-coordinates
- level : specifies the render level order for this glyph
Returns : an object of class GlyphRenderer
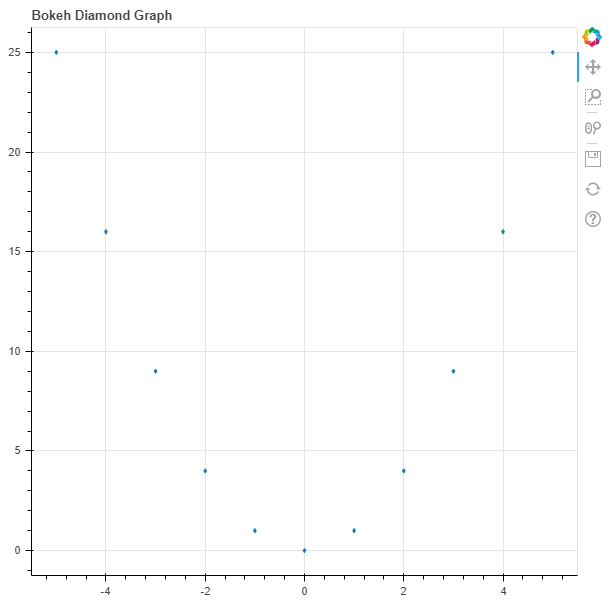
Example 1 :In this example we will be using the default values for plotting the graph.
from bokeh.plotting import figure, output_file, show
output_file("gfg.html")
graph = figure(title = "Bokeh Diamond Graph")
x = [-5, -4, -3, -2, -1, 0, 1, 2, 3, 4, 5]
y = [i ** 2 for i in x]
graph.diamond(x, y)
show(graph)
|
Output :
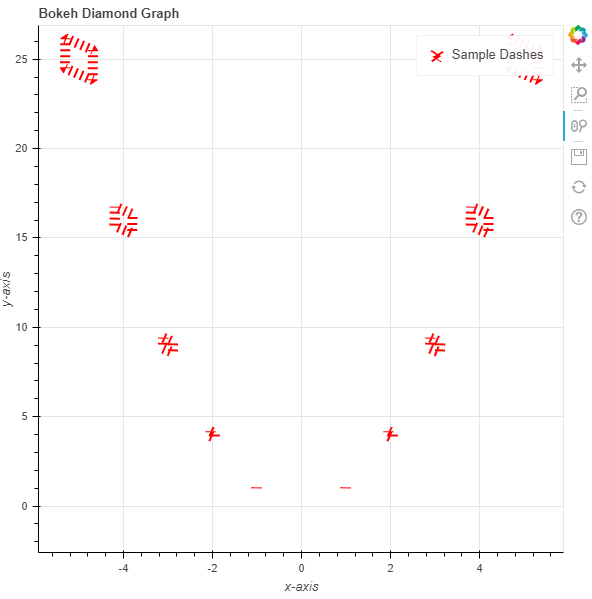
Example 2 :In this example we will be plotting the diamonds with dotted lines alongside other parameters and the size of the diamonds are in proportion to their values.
from bokeh.plotting import figure, output_file, show
output_file("gfg.html")
graph = figure(title = "Bokeh Diamond Graph")
graph.xaxis.axis_label = "x-axis"
graph.yaxis.axis_label = "y-axis"
x = [-5, -4, -3, -2, -1, 0, 1, 2, 3, 4, 5]
y = [i ** 2 for i in x]
size = [i * 2 for i in y]
angle = 10
fill_color = None
line_color = "red"
line_dash = "dotted"
line_dash_offset = 1
line_width = 10
legend_label = "Sample Dashes"
graph.diamond(x, y,
size = size,
angle = angle,
fill_color = fill_color,
line_color = line_color,
line_dash = line_dash,
line_dash_offset = line_dash_offset,
line_width = line_width,
legend_label = legend_label)
show(graph)
|
Output :
Like Article
Suggest improvement
Share your thoughts in the comments
Please Login to comment...